










Educational analysis only, not financial advice. Trading CFDs involves a high risk of loss. Market data as of 4 September 2026, 11:33am GMT+8.
Market Recap Overview
Last week we flagged one release, the US ISM Manufacturing PMI, as the catalyst to watch across four instruments. Tuesday it landed at 54.6%, below the 55.2% forecast and down from July's 55.6%, still the eighth straight month of expansion, just a slower one. A bigger story overshadowed it the same day: fresh US-Iran strikes and a hawkish Fed tone drove the real price action. Here is how gold, EUR/USD, US500 and WTI actually reacted, and how each one carried through the rest of the week to Friday.
Gold Dips on the Miss, Fed Tone Takes Over
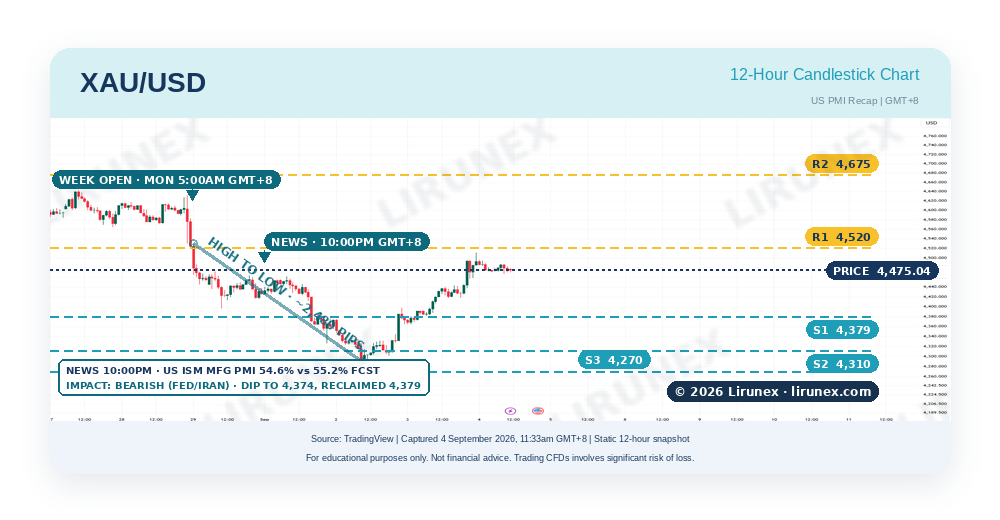
· Before: we flagged 4,520 and 4,675 as resistance, 4,379, 4,310 and 4,270 as support, with gold near 4,435 heading into the release, already lower on the week.
· Result: August PMI printed 54.6%, below the 55.2% forecast and down from July's 55.6%, though a hawkish Fed tone and a yield spike dominated the reaction, not the soft print.
· After: gold sold off hard through Tuesday night, a session low near 4,374.54 (-1.6%), then spent Wednesday and Thursday grinding back up as the yield spike faded, climbing to 4,475 by Friday, 11:33am GMT+8.
· Level check: 4,379 was tested and briefly pierced Tuesday, then held for the rest of the week; Friday's push has 4,520 back in play as the level to watch.
Chart discussion: the PMI miss argued for a bounce, but the yield spike and rate-hike bets won out, showing how a broken support can still hold as a floor once the bigger driver fades.
Mentor tip: a fast spike right at the news minute often retraces once the initial reaction fades, the candle 30 to 60 minutes later usually tells you more about the real trend.
EUR/USD Slides on Dollar Strength, Not the PMI
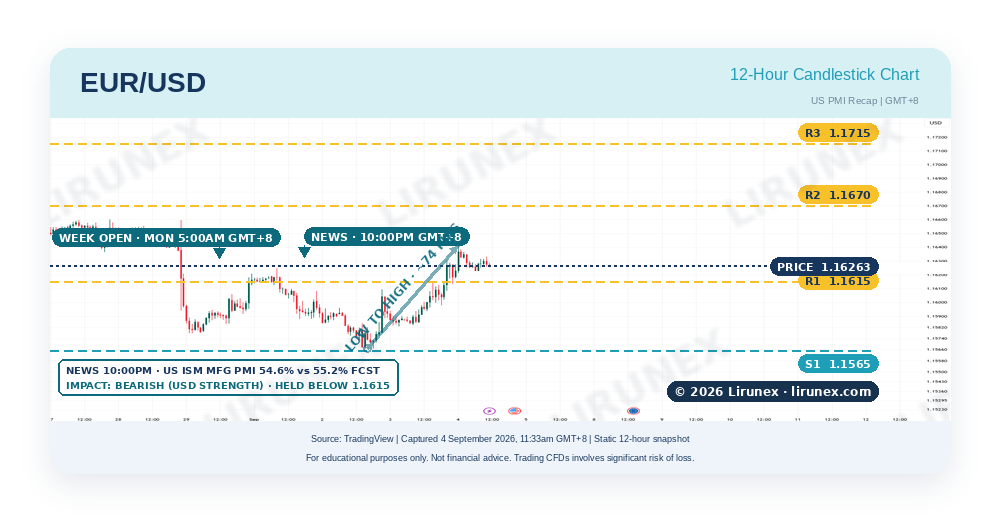
· Before: we flagged 1.1615, 1.1670 and 1.1715 as resistance, 1.1565 as support, with the pair near 1.1608, already below its former support heading into the release.
· Result: the soft PMI print did little for the pair, a hawkish Fed tone and broad dollar strength kept driving EUR/USD lower regardless.
· After: the pair extended its slide through Wednesday and Thursday, testing two-week lows, then climbed steadily into Friday to 1.1626 by 11:33am GMT+8.
· Level check: 1.1615 capped the pair for two sessions before giving way Friday morning; it now trades just above, the level to watch for whether it holds as new support.
Chart discussion: EUR/USD never got a chance to test its resistance levels, the dollar side of the story overpowered the PMI miss and kept price grinding toward 1.1565 instead.
Mentor tip: a break and hold means price closes above or below a level on more than one candle, not just a brief touch during the news spike, that is what separates a real breakout from a false one.
US500 Holds 7,620 Despite the Iran Headlines
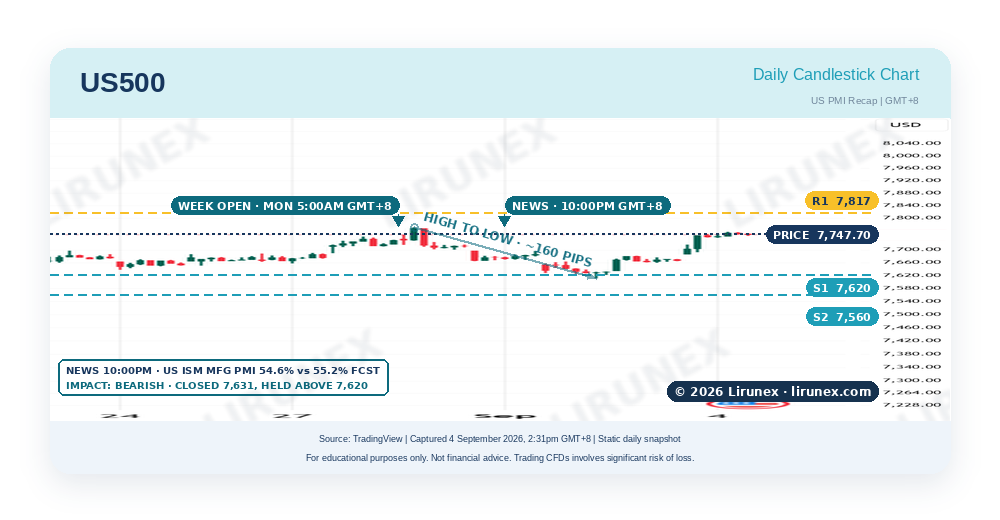
· Before: we flagged 7,817 (the Aug 13 record) as resistance, 7,620 and 7,560 as support, with the index near 7,686 heading into the release.
· Result: the softer PMI added to growth-slowdown concerns on a day already dominated by the Iran headlines and a jump in Treasury yields.
· After: the index closed Tuesday at 7,631.47, down 0.7%, then rebuilt steadily through Wednesday and Thursday to 7,748 by Friday, 11:33am GMT+8.
· Level check: 7,620 held on Tuesday's close, a narrow save; the week's climb has the index back within range of the 7,817 record.
Chart discussion: a soft PMI plus a risk-off news day is a tough combination for equities, the index gave up Friday's level but the 7,620 support did its job on the close.
Mentor tip: a daily close below support matters more than a brief dip during the day, candles that dip and recover by the close often mean the level is still holding.
WTI Breaks Out on Iran, PMI Barely Registers
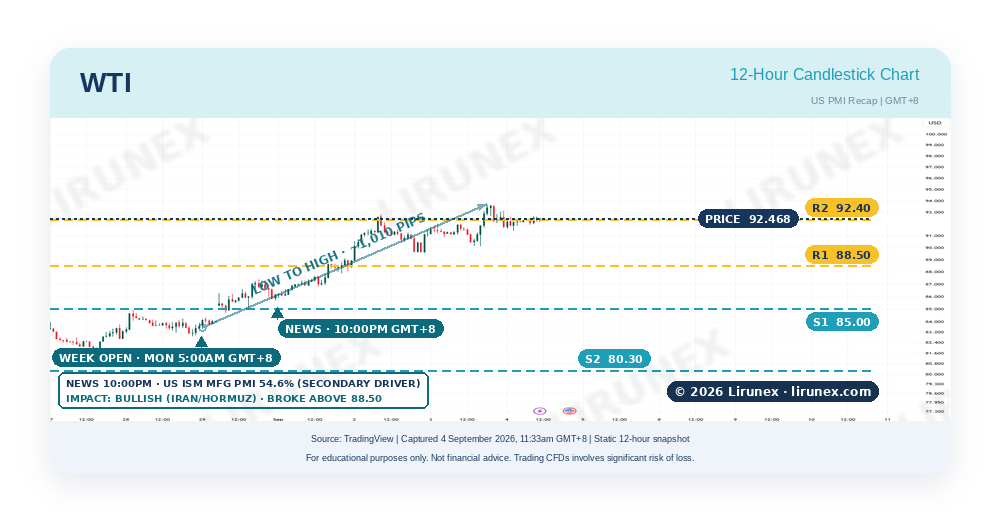
· Before: we flagged 88.50 and 92.40 as resistance, 85.00 and 80.30 as support, with WTI near 87.25, already above its former resistance heading into the release.
· Result: the PMI barely registered, fresh US strikes on Iranian sites and two tankers hit in the Strait of Hormuz drove the entire move instead.
· After: WTI rallied about 4.5% on Tuesday toward 90, eased back toward 89 through Wednesday and Thursday, then pushed to a fresh week high of 92.47 by Friday, 11:33am GMT+8.
· Level check: 88.50 broke clean Tuesday and has held as support on every pullback since; 92.40 gave way Friday, with WTI trading just above it.
Chart discussion: a geopolitical headline can swamp a data print entirely, WTI's breakout through 88.50 and hold above it on the pullback is the clearest level story of the four.
Mentor tip: support and resistance are not exact lines, price often wicks slightly through a level before reversing, so watch the general zone, not one precise number.
What's Next
The bigger mover this week was not the PMI at all: fresh US-Iran strikes and two oil tankers hit in the Strait of Hormuz drove WTI, and a hawkish Fed tone drove the dollar side of gold and EUR/USD. ISM Services PMI (Thursday) and the August jobs report (Friday) are still ahead as this recap goes out, worth watching for a similar gap between the data and the headline story.
Key Takeaway
This week showed how a bigger story, a hawkish Fed and Middle East tensions, can swamp a scheduled release. All four instruments shared the same pattern: a sharp Tuesday reaction, then a steadier grind back toward the levels we flagged. Write down your levels before the news, then check what held. Sub-IBs and partners are welcome to share this recap as educational content. Follow Lirunex for more weekly market updates and educational insights.
Ready to Watch the Next One?
Look back at how the markets in this recap reacted around their key support and resistance levels. You can practise following price movements like these on a free Lirunex demo account, and move to a live account only when you feel ready and fully understand the risks involved. Please note that demo conditions and results may differ from live trading.
[ Open Free Demo Account ] [ Open Live Account ]
Risk Disclaimer: This market recap is educational content only, not financial advice or a recommendation to trade. Market data comes from third-party sources and is not guaranteed and may change without notice. Trading forex, gold, and CFDs involves a high level of risk: you could lose some or all of your capital, and past performance is not a reliable indicator of future results. Lirunex Limited accepts no liability for losses arising from reliance on this material, is regulated by the Labuan FSA (MB/20/0050) and the FSC Mauritius (GB24203882), and does not direct this material at any jurisdiction where its distribution would be unlawful.