










By Anne Sinclair │ Financial Markets Content & Communications Strategist
US CPI Preview: EUR/USD, Gold, US500 and WTI Outlook(12 to 16 October 2026)
This US CPI preview covers the one inflation release that could still change the October Fed meeting. September's consumer price index lands on Wednesday 14 October at 8:30pm GMT+8 with the 10-year yield near a 24-year high, the dollar at a 17-month high and Brent above $100.
Weekly Overview

The September Fed minutes, the backdrop to this US CPI preview, showed all 19 participants backed the rise to 3.75% to 4.00%, and most expected another increase by year end while inflation stays above target; the 10-year yield touched 5.36%, its highest since 2002 (see Lirunex's report on Treasury yields at multi-decade highs), and eased to 5.22% on Tuesday. Weak payrolls split the odds: CME FedWatch prices an October hike near 20% and December near 90%, and New York Fed's Williams said on Tuesday one more hike this year may be appropriate.
On the Lirunex weekly charts, the week behind this US CPI preview gave EUR/USD a fifth straight red candle, gold a rebound inside a bearish structure, US500 a record weekly close and WTI a fourth lower high and low since its September peak. Tuesday's first bank results were mixed, Goldman Sachs and Citigroup beating while JPMorgan and Wells Fargo missed; the S&P 500 closed flat at 7,805, the dollar index slipped 0.4% to 102.2 and Brent held at 105.69. For the last inflation week, see Lirunex's weekly analysis of the ECB decision and August US CPI.
Sources: Babypips: September FOMC Minutes Back Hawkish Stance, But October Hopes Fade| Babypips: Financial and Forex Market Recap, 7 October 2026| Investrade: Market Review, 9 October 2026| Investrade: Market Review, 13 October 2026| Babypips: Financial and Forex Market Recap, 13 October 2026| FXStreet: Forex Today, US Dollar Weakens Ahead of US CPI, 14 October 2026| 24/7 Wall St: Goldman Sachs Rises on Equities-Led Beat, JPMorgan Treads Water, Wells Fargo Declines| Investing.com: EUR/USD Historical Data| Investing.com: XAU/USD Historical Data| Yahoo Finance: S&P 500 Historical Data| Investing.com: Crude Oil WTI Futures Historical Data| Yahoo Finance: September 2026 Jobs Report| Rio Times: Oil Above US$100 and Fed Hike Odds Frame Week, 12 October 2026| Lirunex: Treasury Yields Today Surge to Multi Decade Highs
Market Sentiment and Trading Psychology
Bond traders price more Fed tightening while equity buyers pay record prices; one inflation print decides who blinks. On 7 October gold fell about $100 within hours and recovered $40 by the close: do not anchor on the first headline. As Lirunex's guide to how economic news affects forex puts it, the discipline is to set price levels, position size and stop-loss before the CPI news lands at 8:30pm GMT+8 on Wednesday; that is the practical point of any US CPI preview.
US CPI Preview: What the September Report Could Change
This US CPI preview matters because the Fed has promised another hike by year end without saying when; September's consumer price index is the last inflation reading before the 28 October decision.
Release Details and Consensus
Consensus is +0.5% to +0.6% month on month for the headline consumer price index and +0.2% for core, lifting the annual rates to 3.6% to 3.7% and 2.4% to 2.5%; the Cleveland Fed nowcast sits in the middle. That gap is the story of this US CPI preview: oil points to a high headline, only core inflation can move rate expectations.
US CPI Preview Scenarios: Hot, In Line and Soft
These US CPI preview scenarios are possibilities, not forecasts, and oil can override them; the grid shows the first reaction each could produce.
Scenario grid: possible first reactions (educational, not signals)
PPI, Retail Sales, Bank Earnings and Fed Chair Warsh
Beyond the US CPI preview, Thursday brings producer price inflation, retail sales and jobless claims at 8:30pm GMT+8, Bank of America and Morgan Stanley report Wednesday, and Fed Chair Kevin Warsh speaks Friday at 11:30am GMT+8; the full calendar is in Lirunex's Week Ahead for US CPI and retail sales.
Release schedule at a glance (GMT+8)
Sources: Lirunex: Week Ahead, US CPI and Retail Sales| Trading Economics: United States Calendar| FXEmpire: The Week Ahead, JPMorgan, Goldman Sachs Earnings and CPI Test Stock Market Strength| Admirals: US CPI September 2026 Preview, Scenarios and Fed Odds| FinancialJuice: US CPI Prep, 14 October| Cleveland Fed: Inflation Nowcasting| Investing.com: Earnings Preview, Big Banks, ASML and Regional Lenders, Week of 13 October| TradingKey: The Week Ahead, US September CPI and PPI, Bank Earnings, TSMC| Babypips: Fundies Cheat Sheet, 12 October 2026
Markets That May React
Each instrument is read weekly structure first, then daily agreement, then the one-hour chart: a bullish trend prints higher highs and higher lows, a bearish trend the reverse, and a range sits between support and resistance.
Forex: EUR/USD at a 17-Month Low Into the US CPI Preview
EUR/USD, five weeks down to a 17-month low with a fresh 1.1150 on Tuesday and a rebound to 1.1200 on Wednesday, is the cleanest chart in this US CPI preview.
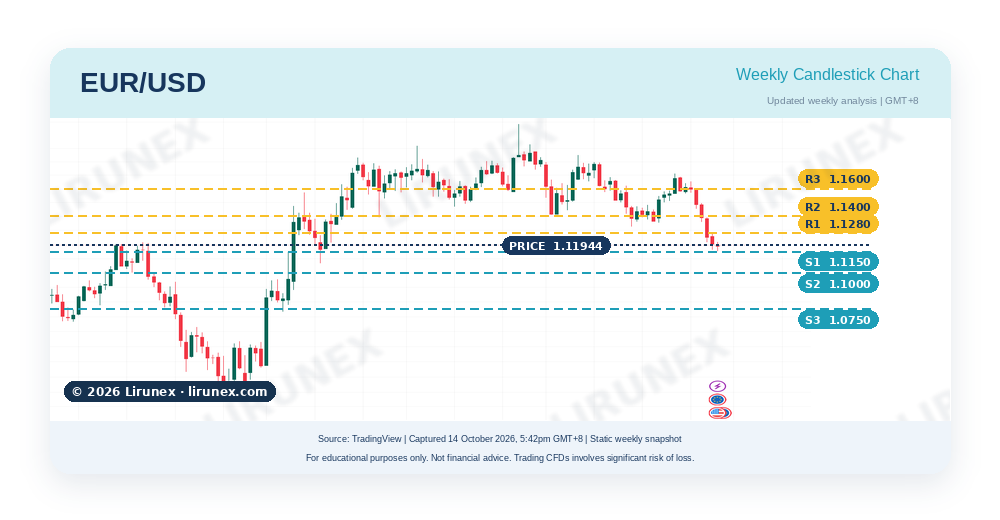
Weekly candle overview: the weekly candle opened at 1.1258, ranged 1.1277 to 1.1161 and closed at 1.1202, bearish and below the prior week, the fifth red week in a row. The daily chart agrees; a weekly close above 1.1280 would invalidate the bias, and only a soft inflation print in this US CPI preview is likely to produce it.
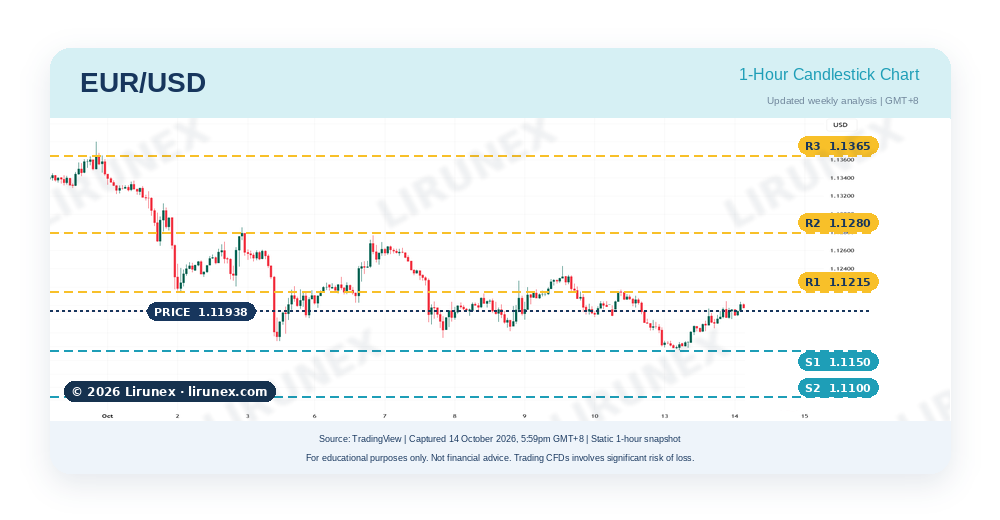
1-hour market analysis: the one-hour chart made a new low at 1.1150 on Tuesday and rebounded to 1.1200 on Wednesday, still under the lower highs at 1.1215 and 1.1280, bearish but stretched.
· Trend: EUR/USD at 1.1194 (14 October 2026, 5:59pm GMT+8), downtrend since mid-September.
· Resistance: 1.1215, then 1.1280 and 1.1365.
· Support: 1.1150, then 1.1100 and 1.1000 (the last below the chart).
· Catalyst to watch: core inflation at 8:30pm GMT+8 on Wednesday.
Chart discussion: traders may monitor whether 1.1150 holds through the US CPI preview window and whether any rebound closes above 1.1215.
Mentor tip: a pair five weeks into a trend needs no reason to continue, but it needs one, such as a soft inflation print, to turn.
Sources: Investing.com: EUR/USD Historical Data| Babypips: Financial and Forex Market Recap, 7 October 2026| DailyForex: Pairs in Focus 12 to 16 October 2026| NordFX: Market Pulse, 9 October 2026
Gold (XAU/USD): A Rebound Inside a Bearish Weekly Structure
Gold fell to 4,066 as the 10-year hit 5.36% and closed Tuesday at 4,177 into this US CPI preview (Lirunex's gold price outlook on Fed hike bets and Middle East risk).
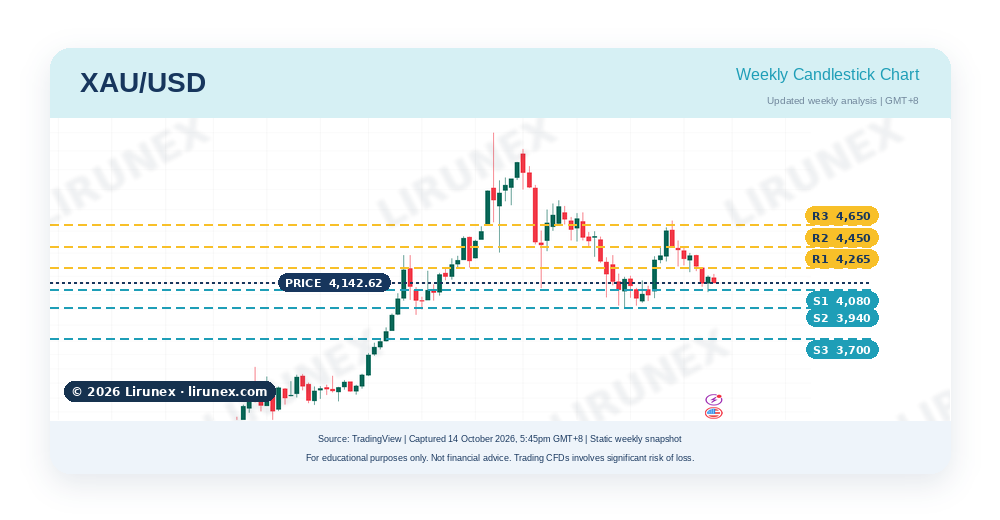
Weekly candle overview: the weekly candle was bullish, +1.24% from 4,144 to 4,194, yet the structure is still bearish: both high and low were lower than the week before. A bullish candle inside a bearish structure is a correction until proven otherwise; the daily chart turned up, so weekly and daily disagree. A weekly close above 4,265 would invalidate the bearish bias; a drop below 4,080 would end the correction.
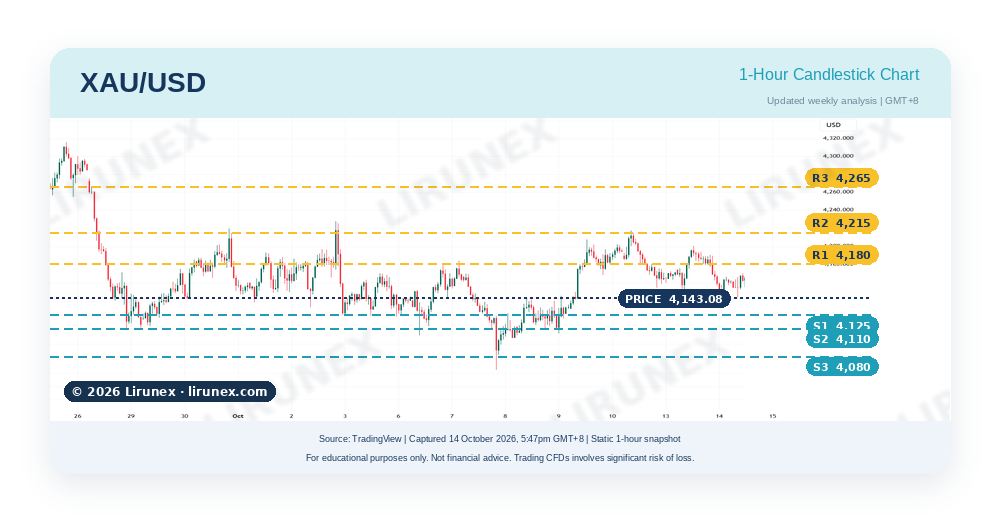
1-hour market analysis: the rebound from 4,080 topped at 4,215 and 4,200, and Wednesday's slide to 4,143 undercut Tuesday's low, leaving the one-hour chart drifting toward the 4,125 base.
· Trend: gold at 4,143.08 (14 October 2026, 5:47pm GMT+8), correcting inside a bearish weekly structure.
· Resistance: 4,180, then 4,215 and 4,265.
· Support: 4,125, then 4,110 and 4,080.
· Catalyst to watch: the 10-year yield's reaction to the inflation data.
Chart discussion: traders may monitor whether 4,125 holds after the US CPI preview release and whether gold can reclaim 4,180.
Mentor tip: gold tracked yields, not inflation headlines, all week; if the 10-year keeps rising, rallies tend to fade.
Sources: FXStreet: Gold Falls to Two-Month Low Near $4,100 on Stronger US Dollar| Rio Times: Gold Fund Gains 1.6% as Treasury Yields Ease| Investing.com: XAU/USD Historical Data| Lirunex: Gold Price Outlook, Fed Rate Hike Bets vs Middle East Risk
US500: Record Highs Tested by Bank Earnings and 5% Yields
US500 sits near 7,825 into the US CPI preview, within 20 points of its 7,845 record, after Tuesday's mixed bank results
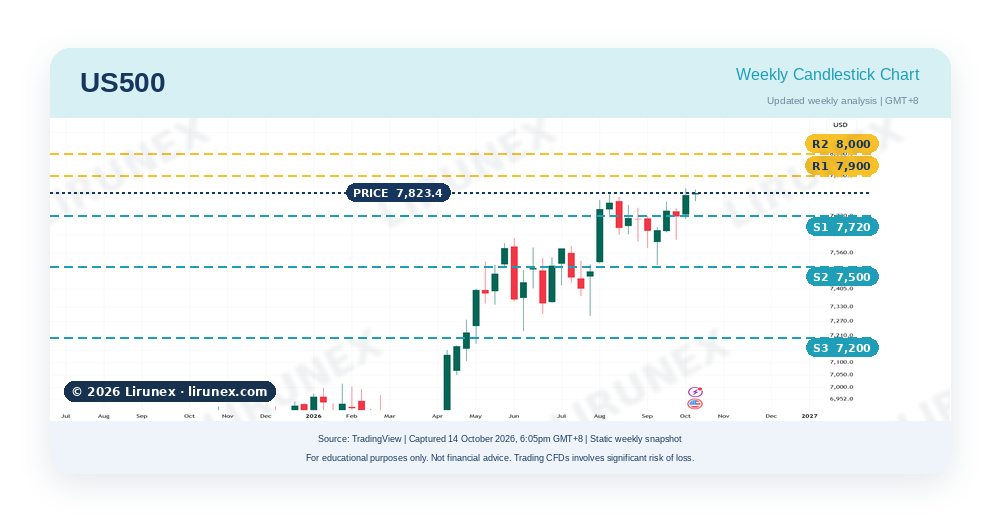
Weekly candle overview: the weekly candle was bullish, +1.15%, with a higher high at 7,845 and a higher low at 7,728; the daily trend agrees. A daily close below 7,748 would invalidate the near-term bias; earnings and the inflation print could confirm the trend above 7,845 or the first lower high since September.
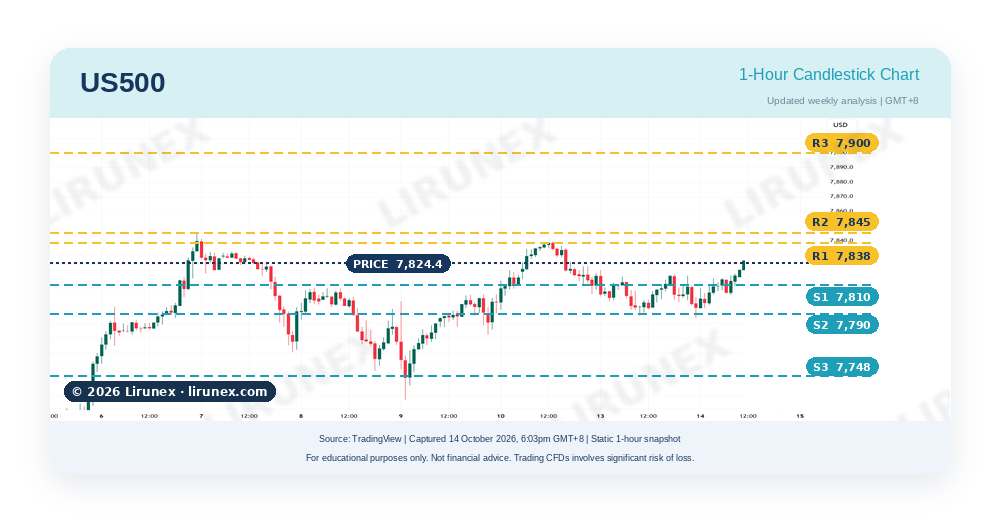
1-hour market analysis: the one-hour chart held 7,790 on Tuesday and Wednesday and is back near 7,825, just under the 7,838 and 7,845 highs; a pullback resolved, not a reversal, with all three timeframes aligned.
· Trend: US500 at 7,824.4 (14 October 2026, 6:03pm GMT+8), uptrend testing its highs.
· Resistance: 7,838, then 7,845 and 7,900.
· Support: 7,810, then 7,790 and 7,748.
· Catalyst to watch: Bank of America and Morgan Stanley on Wednesday, then the consumer price index.
Chart discussion: traders may monitor whether 7,810 holds on any post-CPI dip and whether the index can close above 7,845.
Mentor tip: a record high during a bond sell-off is a choice the market has not yet made.
WTI Crude Oil: Four Weeks Lower While Brent Holds Above $100
WTI settled at 94.14 on Tuesday as tanker attacks near Hormuz offset Trump's pledge not to attack Iran before the midterms and a Russian diesel deal.
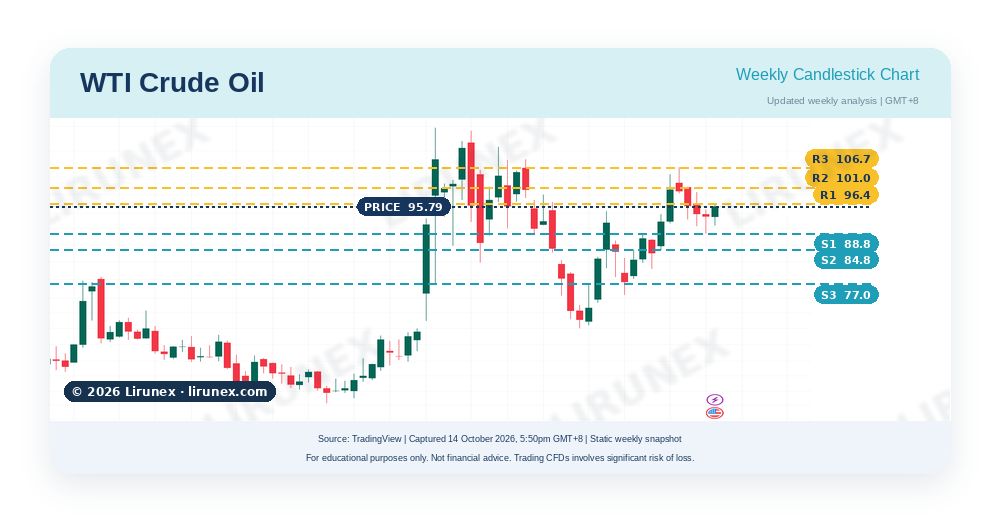
Weekly candle overview: on the Lirunex feed the weekly candle closed marginally red (about -0.4%) with a long lower wick from 88.8, the fourth straight lower high and low since the September peak near 106.7, a correction inside the range since March. The daily chart is sideways. News can spike price without changing the trend.
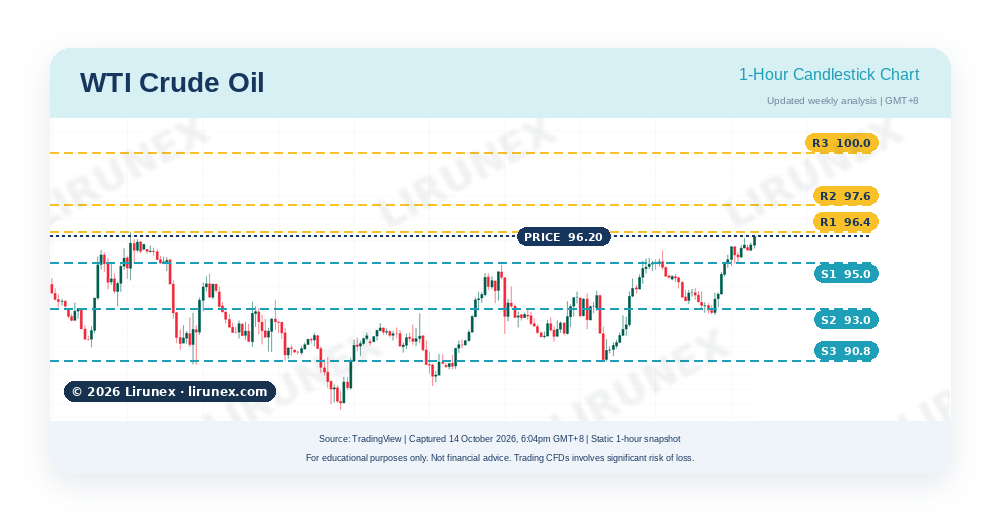
1-hour market analysis: the one-hour chart has climbed from 89.0 through higher lows at 90.8 and 92.9 to 96.3 on Wednesday, above last week's high, a one-hour uptrend pressing 96.4; a close above it would turn the daily structure, below 93.0 would end the run.
· Trend: WTI at 96.20 (14 October 2026, 6:04pm GMT+8, Lirunex feed; futures settled at 94.14 on Tuesday), weekly correction being tested.
· Resistance: 96.4, then 97.6 and 100.0.
· Support: 95.0, then 93.0 and 90.8.
· Catalyst to watch: Hormuz headlines, then EIA inventories at 12:00am GMT+8 on Friday, a day late after Monday's US holiday.
Chart discussion: traders may monitor whether 95.0 holds and whether 96.4 breaks before the US CPI preview turns into Wednesday's inflation number.
Mentor tip: when Brent and WTI diverge this far, the spread shows where the supply fear sits.
Sources: Babypips: September FOMC Minutes Back Hawkish Stance, But October Hopes Fade| Babypips: Financial and Forex Market Recap, 7 October 2026| Investrade: Market Review, 9 October 2026| Investrade: Market Review, 13 October 2026| Babypips: Financial and Forex Market Recap, 13 October 2026| FXStreet: Forex Today, US Dollar Weakens Ahead of US CPI, 14 October 2026| 24/7 Wall St: Goldman Sachs Rises on Equities-Led Beat, JPMorgan Treads Water, Wells Fargo Declines| Investing.com: EUR/USD Historical Data| Investing.com: XAU/USD Historical Data| Yahoo Finance: S&P 500 Historical Data| Investing.com: Crude Oil WTI Futures Historical Data| Yahoo Finance: September 2026 Jobs Report| Rio Times: Oil Above US$100 and Fed Hike Odds Frame Week, 12 October 2026| Lirunex: Treasury Yields Today Surge to Multi Decade Highs
Key Takeaway
The conclusion of this US CPI preview is that Wednesday's core inflation number, not the headline, decides the week: only core can move the October meeting.
· The 10-year yield is the transmission channel for all four instruments in this US CPI preview.
· The dollar is stretched, so a soft inflation print may produce the larger move.
· What could change the outlook: core inflation away from +0.2%, or Brent through $110 on a Hormuz headline.
Trading Education Takeaway
The dominant weekly direction in this US CPI preview is a strong dollar. US500 is the only instrument where all three timeframes align, EUR/USD the only confirmed downtrend, while gold and WTI are mixed, the signature of a correction or range. Only the closes after the inflation print can show which spikes mattered.
Frequently Asked Questions
What does this US CPI preview expect for September inflation?
Consensus is +0.5% to +0.6% month on month for the headline consumer price index and +0.2% for core, putting annual inflation at 3.6% to 3.7% and core at 2.4% to 2.5%.
When is the US consumer price index released in GMT+8?
Wednesday 14 October 2026 at 8:30pm GMT+8 for the consumer price index, so a US CPI preview read on Wednesday still applies; PPI and retail sales follow Thursday.
How do I tell a pullback from a reversal?
A pullback holds the previous swing; a reversal closes beyond it. Gold's bounce from 4,080 is a pullback until it closes above 4,265.
Are the support and resistance levels in this article trading signals?
No. They are reference levels from the chart cards in this US CPI preview, for education only; no level guarantees a bounce or break.
Sources and References
Sources: Lirunex: Week Ahead, US CPI and Retail Sales| Lirunex: Weekly Analysis, ECB and US CPI, Sep 7 to 11| Lirunex: Treasury Yields Today Surge to Multi Decade Highs| Lirunex: How Does Economic News Affect Forex? Key Events That Move Currency Pairs| Lirunex: Gold Price Outlook, Why XAU/USD Is Caught Between Fed Rate Hike Bets and Middle East Risk| Trading Economics: United States Calendar| Admirals: US CPI September 2026 Preview, Scenarios and Fed Odds| FXEmpire: The Week Ahead, JPMorgan, Goldman Sachs Earnings and CPI Test Stock Market Strength| TradingKey: The Week Ahead, US September CPI and PPI, Bank Earnings, TSMC| Babypips: Fundies Cheat Sheet, 12 October 2026| Babypips: September FOMC Minutes Back Hawkish Stance| Babypips: Financial and Forex Market Recap, 7 October 2026| Investrade: Market Review, 9 October 2026| NordFX: Market Pulse, 9 October 2026| DailyForex: Pairs in Focus 12 to 16 October 2026| FXStreet: Gold Falls to Two-Month Low Near $4,100| Rio Times: Gold Fund Gains 1.6% as Treasury Yields Ease| Rio Times: Oil Above US$100 and Fed Hike Odds Frame Week| Investing.com: EUR/USD Historical Data| Investing.com: XAU/USD Historical Data| Yahoo Finance: S&P 500 Historical Data| Investing.com: Crude Oil WTI Futures Historical Data| Yahoo Finance: September 2026 Jobs Report| Federal Reserve: FOMC Meeting Calendars, Statements and Minutes
Ready for the Market's Next Move?
Follow this week's inflation data, retail sales and bank earnings alongside Lirunex's Week Ahead calendar, and practise observing how EUR/USD, gold, US500 and WTI react around the release with a free Lirunex demo account, within a simulated environment. Open a live account once you feel ready and understand the risks involved. Demo conditions and results may differ from live trading.
Open Free Demo Account Open Live Account
Risk Disclaimer: This content is for educational and informational purposes only and does not constitute investment advice. Forex and CFD trading involve significant risk of loss and may not be suitable for all investors. Past performance is not indicative of future results. High impact events may cause sharp volatility, wider spreads and sudden price movements. Please understand the risks before trading. Market data as of 14 October 2026, 6:05pm GMT+8; weekly figures and Tuesday closes from Investing.com and Yahoo Finance; chart cards from Lirunex-feed TradingView weekly and one-hour charts captured 14 October between 5:42pm and 6:05pm GMT+8.