










Educational analysis only, not financial advice. Trading CFDs involves a high risk of loss. Market data as of 24 August 2026, 4:27pm GMT+8.
Weekly Market Overview
Welcome to our pairs to watch this week, and a special welcome if you are brand new to trading: everything here is explained in plain language. Inflation is the theme. Australia posts CPI on Wednesday morning, the US follows with its own inflation gauge that night, and Canada closes the week with GDP. Mentor tip: read one section at a time, slowly.
Wednesday, Aug 26, AUD/USD: Australia Monthly CPI (9:30am GMT+8)
Australia releases July's monthly CPI Wednesday at 9:30am GMT+8, including the RBA's preferred trimmed mean. June cooled to 3.8% from 4.0%, trimmed mean 3.6%. The cash rate sits at 4.35%, and markets still price roughly a 60% chance of one more hike this year. A hot print lifts the Aussie; a soft one works the other way. Monday's open was quiet, easing back after an early push higher.
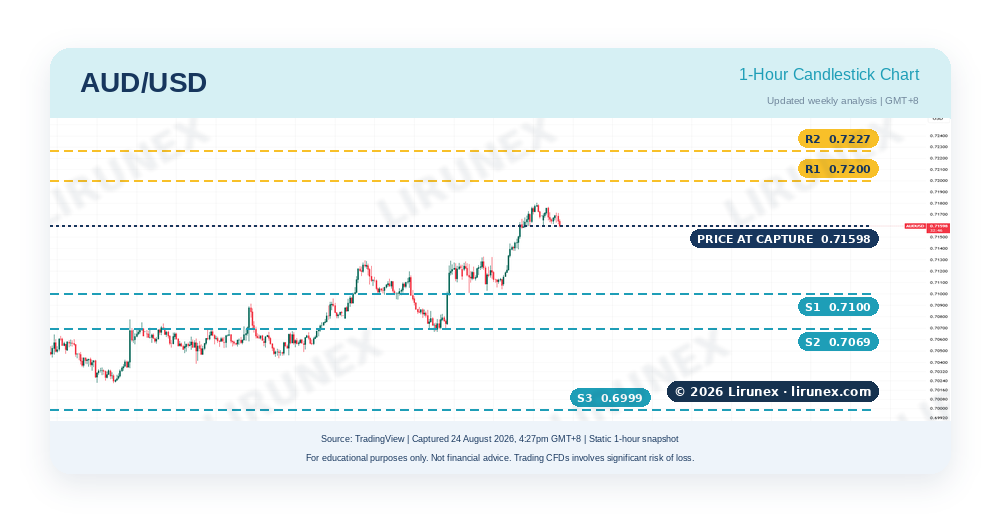
· Trend: rising; Monday's open near 0.7170 pushed to 0.7180 before easing to near 0.7160.
· Resistance: 0.7200, then 0.7227, this year's high, then 0.7300.
· Support: 0.7100, then 0.7069 near the 100-day average, then 0.6999.
· Watch: the trimmed mean; it guides the RBA more than the headline.
Chart discussion: price is pressing resistance at 0.7200 after a strong run. Rejection wicks there would often rotate price back toward 0.7100, while a clean break and hold above it would hint at 0.7227, then 0.7300.
Mentor tip: CPI measures how fast everyday prices rise. Faster inflation often brings higher interest rates, which tends to support a currency.
Wednesday, Aug 26, Gold (XAU/USD): US Core PCE and Q2 GDP (8:30pm GMT+8)
Wednesday also brings a double US release at 8:30pm GMT+8: July core PCE, the Fed's favored inflation gauge, and the second Q2 GDP estimate, together. Gold has been rallying on a softer dollar since the Treasury's buyback plan. A cooler PCE could push it further; a hotter one could pull it back toward support. Monday's open extended that breakout to a fresh high before easing by afternoon.
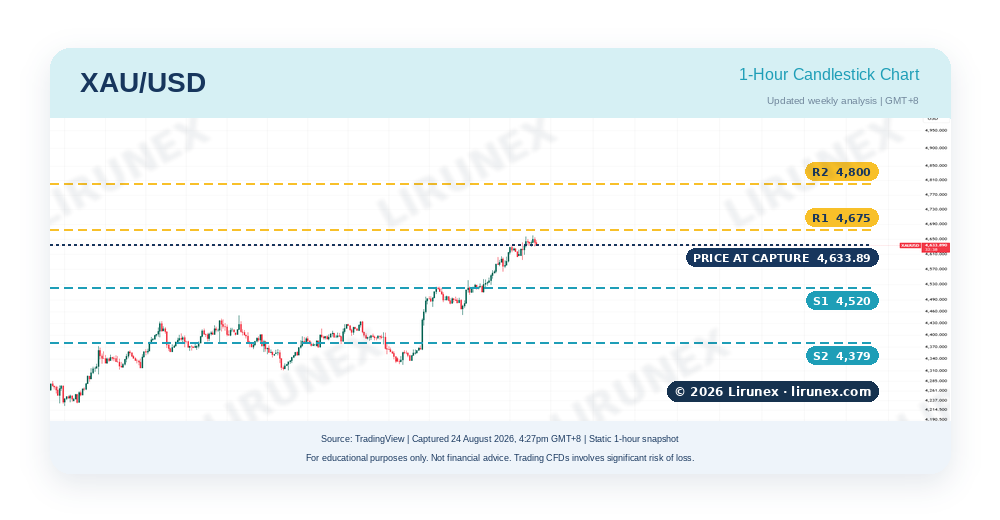
· Trend: strong rally; Monday's open pushed to a fresh high near 4,650 before easing to 4,634.
· Resistance: 4,675, then the round 4,800 level.
· Support: 4,520, the mid-August high, then 4,379.
· Watch: the monthly core PCE figure; markets react to it within seconds.
Chart discussion: after a long climb, candles often pause or pull back near round numbers like 4,800. A rejection there would hint at a rest toward 4,520, while acceptance above it would keep buyers in charge.
Mentor tip: gold pays no interest, so when US inflation cools and rate expectations fall, holding gold costs less and it often gains.
Friday, Aug 28, USD/CAD: Canada Monthly GDP (8:30pm GMT+8)
Canada closes the week with June GDP Friday at 8:30pm GMT+8, completing the Q2 picture. Markets expect growth of about 0.2% after 0.3% in May. The Bank of Canada held at 2.25% in July, and firmer oil has been supporting the loonie. USD/CAD had slipped for over a week, then reversed hard Monday to its best level in over a week. A strong GDP print could pressure it back down; a miss could extend the bounce.
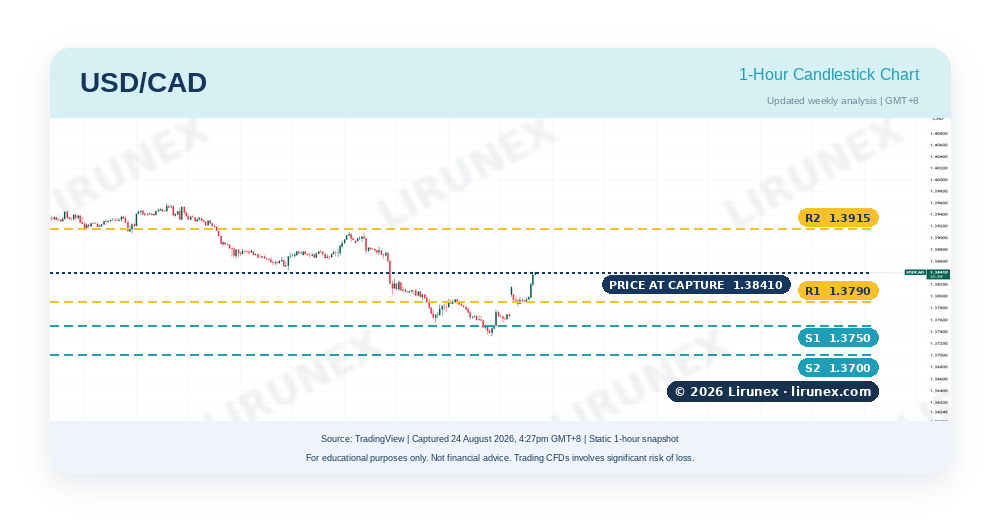
· Trend: reversing higher on Monday; the pair broke back above 1.3790 to trade near 1.3841.
· Resistance: 1.3790, now a level to hold as support, then 1.3915 near the 100-day average.
· Support: 1.3750, then 1.3700.
· Watch: oil prices too; a stronger oil market often strengthens the CAD.
Chart discussion: Monday's rally took price back above the old 1.3790 resistance, which would now need to hold as support on any pullback. Losing it again would point back toward 1.3750, while a daily close above 1.3915 would hint at a bigger shift in the trend.
Mentor tip: USD/CAD falling means the Canadian dollar is getting stronger, not weaker. The second currency gains when the pair drops.
Other Data to Note
Thursday brings US weekly jobless claims at 8:30pm GMT+8, forecast near 209K after 206K. The Jackson Hole symposium runs Thursday to Saturday, with the Fed Chair speaking Friday night GMT+8, words that can move the dollar, gold, and every major pair. Nvidia also reports earnings midweek. Release schedules may change, so check the calendar daily.
Key Takeaway
This week is one story told three times: how fast are prices rising, and what will central banks do about it? Australia answers first, the US follows Wednesday night, Canada adds growth data Friday. New to trading? Do not follow everything at once; pick one pair, note its levels, and watch how price behaves around the news. Sub-IBs and partners are welcome to share this outlook as educational content. Follow Lirunex for more weekly market updates and educational insights.
Ready to Explore This Week’s Key Market Levels?
Review the selected markets and key support and resistance levels highlighted in this week’s analysis. Practise observing price movements with a free Lirunex demo account, or open a live account when you feel ready and fully understand the risks involved. Demo conditions and results may differ from live trading.
[ Open Free Demo Account ] [ Open Live Account ]
Risk Warning: This content is for educational purposes only and is not financial advice or a recommendation to trade. Market data comes from third-party sources believed reliable but is not guaranteed and may change without notice. Trading forex, gold, and CFDs carries a high level of risk; you could lose some or all of your capital, and past performance is not a reliable indicator of future results. Lirunex Limited accepts no liability for losses arising from reliance on this material, is regulated by the Labuan FSA (MB/20/0050) and the FSC Mauritius (GB24203882), and does not direct this material at any jurisdiction where its distribution would be unlawful.