By Anne Sinclair │ Financial Markets Content & Communications Strategist
Fed Meeting Preview: Hawkish Hold or Second Hike? Gold, EUR/USD, US500 and WTI (26 to 30 October 2026)
This Fed meeting preview covers four central banks in 40 hours: the Bank of Canada tonight, the Fed at 2:00am GMT+8 Thursday, the ECB that evening and the Bank of Japan on Friday, with US GDP, PCE and three mega-cap reports between. With a hold priced near 93%, the wording is the event.

Weekly Overview
September CPI at 3.7% set the hawkish backdrop, yet the 10-year yield has fallen three weeks running, from 5.31% to 4.99%, as weak chip earnings and a 29K payroll pushed money into Treasuries (Lirunex's report on Treasury yields at multi-decade highs). Hike odds for this meeting ended near 7% after Fed Chair Warsh declined to pre-judge it; December is priced near 84%. Netflix beat and fell 5% on guidance, Tesla beat with profit down 43%, and Meta grew revenue 26%, lifted capital spending to $145 billion, then raised $97.5 billion of equity on Tuesday. US500 ended the week at 7,624 and rebounded to 7,722 as consumer confidence printed 91.7 against 80.4 expected; the flash PMIs split, eurozone 51.9 against the US at 57.6.
On the Lirunex weekly charts the 19 to 23 October week gave EUR/USD a red inside candle before this week's slide through 1.1113, gold a 3.8% fall through 4,073, US500 a second lower high and lower low, and WTI a second green week to 103.27 after a tanker strike near Hormuz, which keeps the inflation stakes high for this Fed meeting preview (compare Lirunex's Fed, BoE and BoJ week, 14 to 18 September).
Sources14Research and data references for this section · tap to view▾
Market Sentiment and Trading Psychology
Four decisions in 40 hours invite the oldest mistake of a Fed meeting preview week: trading the first headline and being wrong-footed by the next. Lirunex's guide to how economic news affects forex explains why the statement moves the dollar and the press conference moves it back; set levels, size and stop-loss before 2:00am GMT+8.
Fed Meeting Preview: Four Banks, Four Different Questions
Each central bank in this Fed meeting preview faces a different question, answered in sequence.
The Federal Reserve: Hawkish Hold or Second Hike?
The FOMC concludes tonight at 3.75% to 4.00% with no new projections and 94 of 100 economists expecting a hold, so the signal sits in the statement: keeping "inflation remains elevated" holds December live, softer wording on jobs would read as dovish. The July dissenters Hammack, Kashkari and Logan vote again, so a hawkish dissent is the realistic surprise, and Warsh gives no forward guidance, so the 2:30am press conference may add volatility (Lirunex's guide to FOMC minutes).
ECB, Bank of Japan and Bank of Canada in the Fed Meeting Preview Window
The ECB decides on Thursday at 9:15pm GMT+8 at 2.50% with a hold expected after September inflation of 3.8% and a flash PMI at 51.9; the question is whether Lagarde keeps December open. The Bank of Japan announces on Friday around 11:00am GMT+8, a hold at 1.25% expected after Tokyo CPI at 7:30am. The Bank of Canada decides tonight at 9:45pm with a hike to 2.50% priced about three in four, hours after the RBNZ surprised by holding at 2.75%. Thursday 8:30pm GMT+8 adds US GDP (consensus 3.0%) and September PCE (3.6% headline, 3.1% core); Microsoft and Alphabet report at about 4:05am that morning and Amazon on Friday, so this Fed meeting preview week packs the Fed and three of US500's largest members into 30 hours.
Fed meeting preview scenario grid: possible first reactions (educational, not signals)
Fed meeting preview schedule at a glance (GMT+8)
Sources9Research and data references for this section · tap to view▾
Markets That May React
Each instrument is read weekly structure first, then daily agreement, then the one-hour chart: a bullish trend prints higher highs and higher lows, a bearish trend the reverse.
Forex: EUR/USD Between the Fed Meeting Preview and the ECB
EUR/USD closed last week at 1.1203 and trades at 1.1124 after dipping to 1.1108 on Wednesday, through the 15 October low at 1.1113, as the dollar firmed into the Fed.
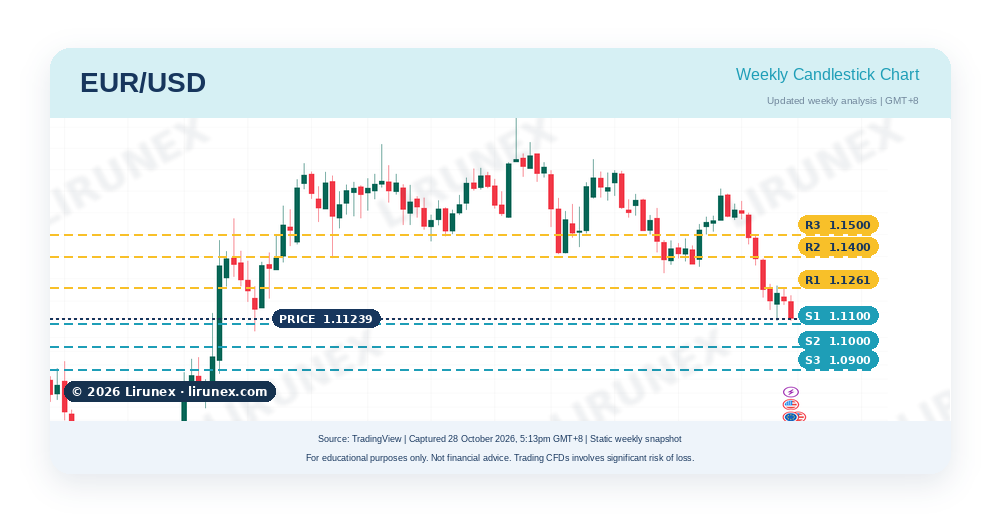
Weekly candle overview: the latest completed candle opened at 1.1206, reached 1.1261, dipped to 1.1182 and closed at 1.1203, a red candle inside the prior week's range: the correction stalled under 1.1277 and this week's break of 1.1200 points back down. A weekly close below 1.1113 would confirm the downtrend; above 1.1261 would reopen the correction.
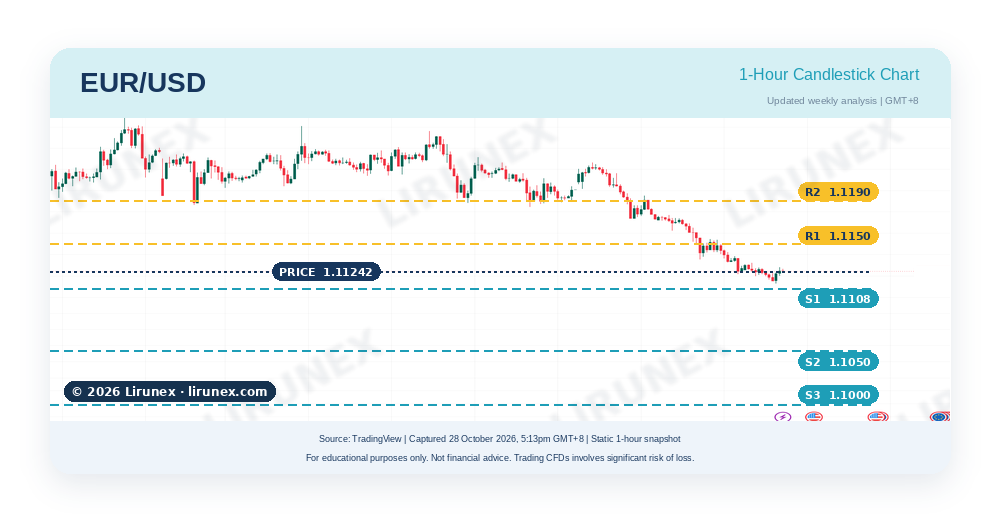
1-hour market analysis: the one-hour chart has stepped down through 1.1261, 1.1220 and 1.1190 and printed 1.1108, a few pips under the 15 October low, a slide the Fed statement tests first and an ECB hold could extend; the Fed meeting preview week decides it.
- Trend: EUR/USD at 1.1124 (28 October 2026, 5:13pm GMT+8), downtrend since mid-September.
- Resistance: 1.1150, then 1.1190 and 1.1261.
- Support: 1.1108, then 1.1050 and 1.1000.
- Catalyst to watch: the Fed at 2:00am GMT+8 Thursday, then the ECB at 9:15pm.
Chart discussion: traders may monitor whether 1.1108 holds through the Fed and whether the ECB can lift the pair back through 1.1190.
Mentor tip: when two central banks decide on one day, the second has the last word.
Sources3Research and data references for this section · tap to view▾
Gold (XAU/USD): Four Banks, One Variable in the Fed Meeting Preview
Gold closed last week at 3,996 after a 3.8% fall through 4,073 and trades at 4,050 under a stalled bounce at 4,066; its one variable is the real yield after Thursday's statement (Lirunex's gold FOMC recap).
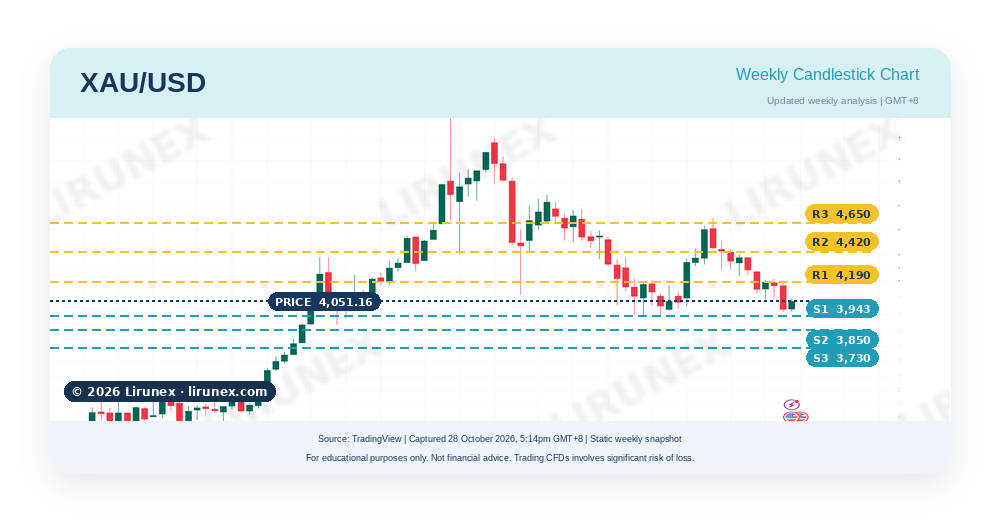
Weekly candle overview: the latest completed candle opened at 4,160, failed at 4,190, fell to 3,975.64 and closed at 3,995.80, a full-bodied red candle through the range floor at 4,073. A weekly close back above 4,073 would make the break false; below 3,943, the July low, would open the next leg.
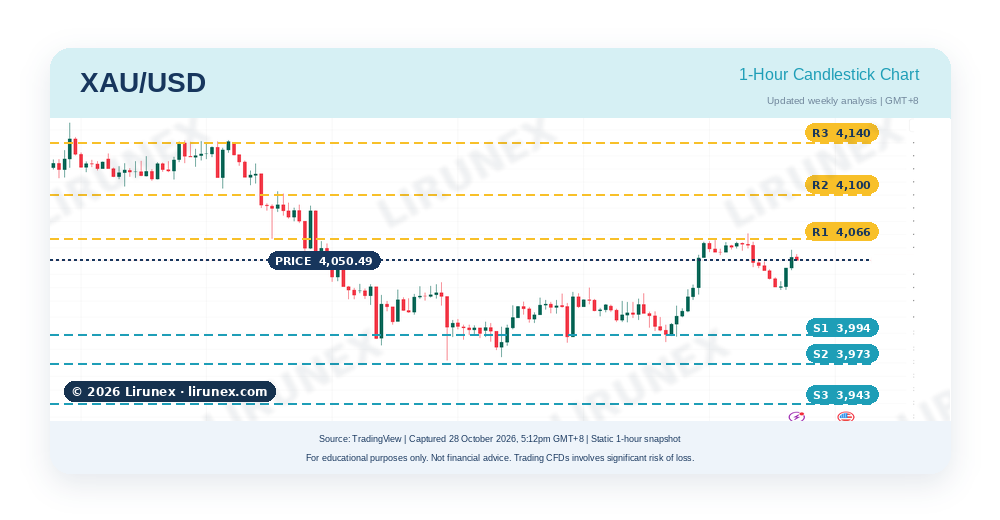
1-hour market analysis: the one-hour chart bounced from 3,973 to 4,066 as oil eased and is holding 4,050 into the Fed, capped under the old floor at 4,073; a hawkish hold tests 3,994 first, softer jobs language 4,100.
- Trend: gold at 4,050 (28 October 2026, 5:12pm GMT+8), downtrend resumed on the weekly chart.
- Resistance: 4,066, then 4,100 and 4,140.
- Support: 3,994, then 3,973 and 3,943.
- Catalyst to watch: the Fed statement and press conference, then PCE at 8:30pm GMT+8.
Chart discussion: traders may monitor whether 3,994 holds through the Fed and PCE and whether gold closes back above 4,073.
Mentor tip: gold trades the gap between the decision and what was priced the night before.
Sources3Research and data references for this section · tap to view▾
US500: The Fed Meeting Preview and Three Mega-Cap Reports in 30 Hours
US500 closed last week at 7,624, a second lower high and lower low, rebounded to 7,722 and meets the Fed, Microsoft, Alphabet, GDP and Amazon within 30 hours.
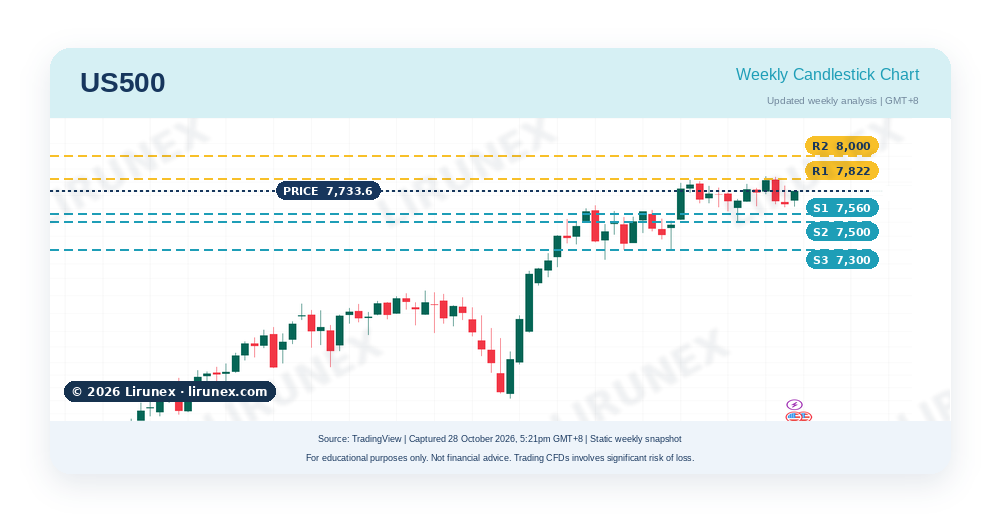
Weekly candle overview: the latest completed candle opened at 7,703, reached 7,770 on the Meta results, fell to 7,612 and closed at 7,624, a second lower high and lower low: a correction, not a reversal, while 7,560 holds. A weekly close below 7,560 would turn the structure bearish; above 7,822 would restore it.
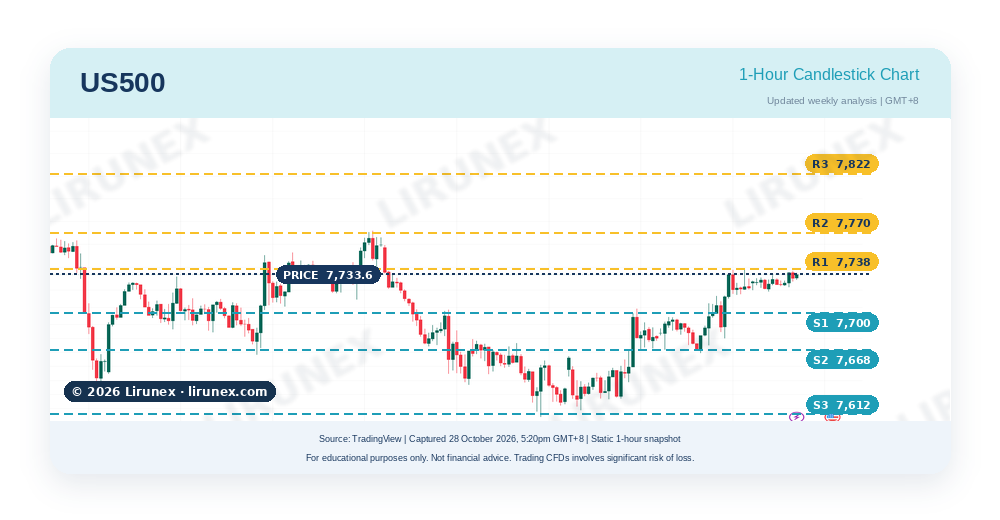
1-hour market analysis: the one-hour chart has made higher lows from 7,612 to 7,734 under the 7,738 to 7,770 band where last week's rally failed; a close above 7,770 would say the correction is over, a break of 7,668 that it is not, and the Fed meeting preview night decides which.
- Trend: US500 at 7,733.6 (28 October 2026, 5:20pm GMT+8), uptrend in correction.
- Resistance: 7,738, then 7,770 and 7,822.
- Support: 7,700, then 7,668 and 7,612.
- Catalyst to watch: the Fed at 2:00am GMT+8 Thursday, Microsoft and Alphabet two hours later, PCE that evening.
Chart discussion: traders may monitor whether 7,668 holds through the Fed and whether the index closes above 7,770.
Mentor tip: when the Fed and mega-cap earnings land in one night, the index follows whichever moves the discount rate more.
Sources3Research and data references for this section · tap to view▾
WTI Crude Oil: The Inflation Variable in the Fed Meeting Preview
WTI closed last week at 103.27, a second green week, eased to 101.5 as Iran talks resumed and trades near 102.9 again after a Houthi claim against the Ras Tanura refinery.
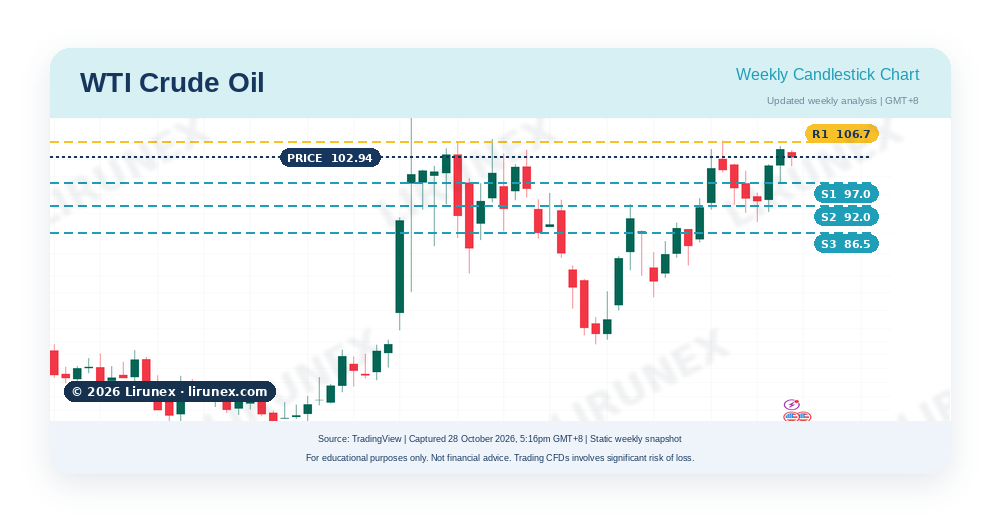
Weekly candle overview: the latest completed candle opened near 99.0, dipped to 97.0, ran to 105.4 on Friday's tanker headline and closed at 103.27, a second higher high and higher low: the uptrend from July is intact. A weekly close above 106.7, the September high, would extend it; below 97.0 would be the first lower low since July.
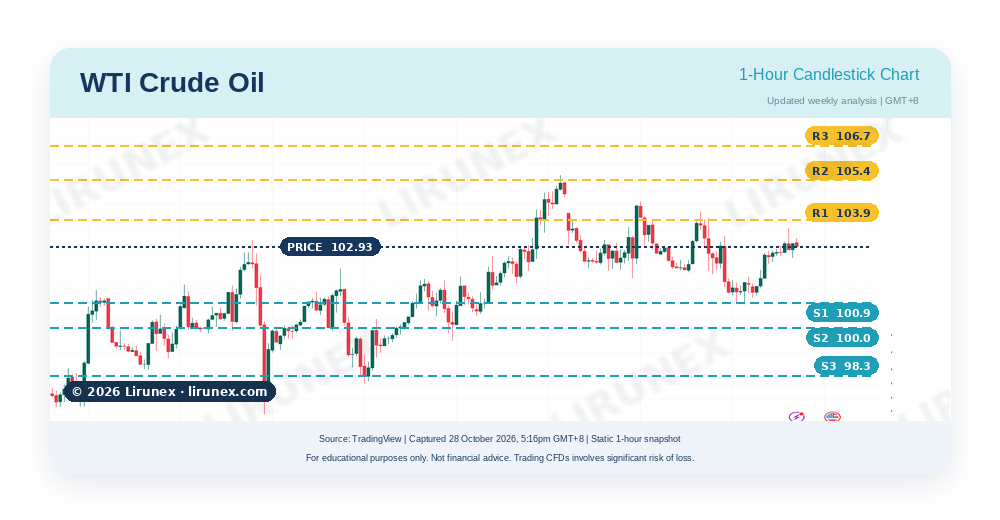
1-hour market analysis: the one-hour chart is a narrowing triangle, higher lows from 95.5 to 100.9 against lower highs from 105.4; the EIA report at 10:30pm GMT+8 and the Fed's inflation wording decide which side gives, while Hormuz flows near 60% of normal keep the headline risk one-sided.
- Trend: WTI at 102.93 (28 October 2026, 5:16pm GMT+8), uptrend consolidating.
- Resistance: 103.9, then 105.4 and 106.7.
- Support: 100.9, then 100.0 and 98.3.
- Catalyst to watch: EIA inventories 10:30pm GMT+8 tonight, the Fed at 2:00am, then Iran and Houthi headlines.
Chart discussion: traders may monitor whether 100.9 holds on a hawkish Fed and whether a close above 103.9 reopens 105.4.
Mentor tip: in a headline market the stop-loss matters more than the entry; two dollars can print in one candle.
Sources4Research and data references for this section · tap to view▾
Key Takeaway
The conclusion of this Fed meeting preview is that the statement's wording and any hawkish dissent will move the dollar more than the decision; the ECB, the BoJ and oil decide how long the move lasts.
- The 10-year yield's reaction to the statement and PCE is the transmission channel for all four instruments in this Fed meeting preview.
- WTI carries the inflation risk of this Fed meeting preview: a Hormuz headline can add two dollars in an hour whatever Warsh says.
- What could change the outlook: a hike or three-vote dissent, a hot PCE print, an Iran ceasefire that drains the oil premium, or a mega-cap spending shock.
Trading Education Takeaway
The dominant weekly direction in this Fed meeting preview is a firmer dollar: EUR/USD and gold are downtrends resuming, US500 an uptrend in correction, WTI an uptrend consolidating. A pullback holds the last swing, a reversal breaks it on a close; central bank volatility does neither.
Frequently Asked Questions
What does this Fed meeting preview expect on 28 October?
A hold at 3.75% to 4.00% with hawkish wording, priced near 93%; the realistic surprise is a dissent for a hike, and December is priced near 84%.
What time are the Fed, ECB, BoC and BoJ decisions in GMT+8?
Bank of Canada Wednesday 9:45pm; Fed Thursday 2:00am, press conference 2:30am; ECB Thursday 9:15pm; Bank of Japan Friday about 11:00am, all in this Fed meeting preview week.
Why do GDP and PCE on the same night matter for this Fed meeting preview?
Because they arrive 18 hours after the statement: PCE at 3.6% or above confirms December, a soft print undoes the reaction.
Are the support and resistance levels in this article trading signals?
No. They are reference levels from the chart cards in this Fed meeting preview, for education only; no level guarantees a bounce or break.
Sources and References
Sources29Research and data references for this section · tap to view▾
Ready for the Market's Next Move?
Follow the Fed, ECB and BoJ decisions alongside Lirunex's guide to FOMC minutes, and practise observing how gold, EUR/USD, US500 and WTI react with a free Lirunex demo account, within a simulated environment. Open a live account once you feel ready and understand the risks involved. Demo conditions and results may differ from live trading.
Open Free Demo Account Open Live Account
Risk Disclaimer: This content is for educational and informational purposes only and does not constitute investment advice. Forex and CFD trading involve significant risk of loss and may not be suitable for all investors. Past performance is not indicative of future results. High impact events may cause sharp volatility, wider spreads and sudden price movements. Please understand the risks before trading. Market data as of 28 October 2026, 5:21pm GMT+8; weekly figures from the 19 to 23 October closes, Tuesday closes from Investrade and Saxo; chart cards from Lirunex-feed TradingView captures, 28 October, 5:12pm to 5:21pm GMT+8.