By Anne Sinclair │ Financial Markets Content & Communications Strategist
Q3 Earnings Season Outlook: Tesla, Meta and Netflix Test a Shaken US500 (19 to 23 October 2026)
This Q3 earnings season outlook opens after the worst week for US500 since June, a 1.95% fall to 7,659 on a chip selloff despite 84% of early reporters beating, and a 0.4% Monday rebound. The week brings 79 S&P 500 results, led by Netflix, SpaceX, Meta and Tesla, Friday's flash PMIs and a Federal Reserve in blackout.
Weekly Overview

Inflation ran hot last week: September consumer prices rose 3.7% on the year, core 2.6%, producer prices 1.3%, retail sales 0.8%. Yet the 10-year yield fell from 5.31% to 5.10% as the selloff sent money into Treasuries (Lirunex's report on Treasury yields at multi-decade highs), and after Fed Chair Warsh declined to pre-judge October, hike odds fell from above 50% to near 15%.
On Monday the S&P 500 rose 0.41% to 7,690 and the Nasdaq 1.1% as chips snapped an eight-day losing streak, while the 10-year yield climbed back to 5.14% and the dollar index to 102.0. Gold slipped 0.6%, and front-month WTI rose 2.2% as a tanker struck a mine near Hormuz and Houthi attacks hit Saudi facilities. Against that, Pakistan's army chief is in Tehran amid reports of a possible US-Iran de-escalation, and Ukraine has offered to pause refinery strikes ahead of talks in Norway.
On the Lirunex weekly charts the week behind this Q3 earnings season outlook gave US500 a bearish candle, EUR/USD a first green week in six, gold a red candle and WTI a 10% surge; this week has opened inside those ranges.
Sources16Research and data references for this section · tap to view▾
Market Sentiment and Trading Psychology
Last week broke the rule that good earnings lift an index: beats were sold on what AI spending will cost. Lirunex's guide to reading sentiment when gold and oil send mixed signals explains why: gold falling with stocks while oil rose means yields, not fear, drove it. The discipline in this Q3 earnings season outlook is to judge each report on guidance and decide levels, size and stop-loss before results land.
Q3 Earnings Season Outlook: What the Week Brings
This Q3 earnings season outlook rests on one tension: FactSet has 9% of the S&P 500 reported, 84% beating and third-quarter earnings growth of 29.0%, yet the index just lost 2% in a week; profits can still rescue it if guidance holds.
Q3 Earnings Season Outlook: Netflix, Tesla and Meta
Netflix and SpaceX report after Tuesday's close (Wednesday 4:00am GMT+8, SpaceX's webcast 4:30am): Netflix consensus earnings per share $0.82, up 39%, on $12.87 billion; SpaceX's second report as a listed company tests the AI spending theme. Meta and Tesla follow after Wednesday's close (Thursday from 4:00am GMT+8): Meta $5.94 to $6.11 a share on about $63.3 billion, with $130 to $145 billion capital spending guidance the question; Tesla $0.45, down 10%, on $27.9 billion.
Q3 earnings season outlook scenario grid: possible first reactions (educational, not signals)
Flash PMIs, Housing Data and the Fed Blackout
Away from earnings, this Q3 earnings season outlook week brings housing starts on Tuesday, UK inflation on Wednesday at 2:00pm GMT+8 (consensus 3.4% from 3.1%, with Tuesday's jobless rate down to 4.7% and a November Bank of England hike 95% priced), and Friday's flash PMIs, the US at 9:45pm GMT+8 (see Lirunex's US PMI recap). The Fed is in blackout before the 27 to 28 October meeting, hike odds near 15%.
Release schedule at a glance (GMT+8)
Sources14Research and data references for this section · tap to view▾
Markets That May React
Each instrument is read weekly structure first, then daily agreement, then the one-hour chart: a bullish trend prints higher highs and higher lows, a bearish trend the reverse. Levels come from Lirunex-feed cards captured 20 October around noon GMT+8.
US500: The Q3 Earnings Season Outlook Meets an Eight-Day Chip Slide
US500 enters the Q3 earnings season outlook at 7,693, below the 7,845 record, after its worst week since June.
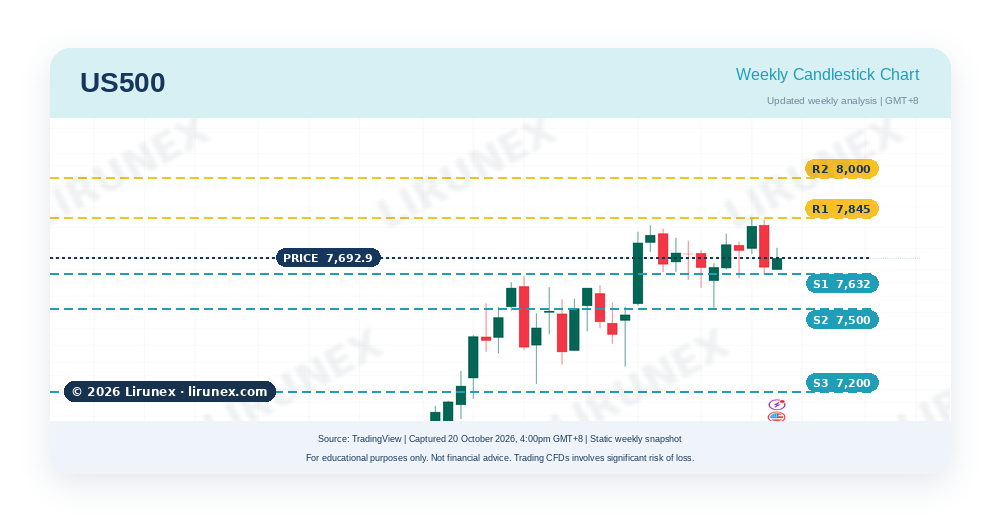
Weekly candle overview: last week's candle opened at 7,813, ranged 7,822 to 7,632 and closed at 7,659, the first lower high and lower low since September: tested, not ended. A weekly close below 7,560 would turn the structure bearish, above 7,822 would restore it.
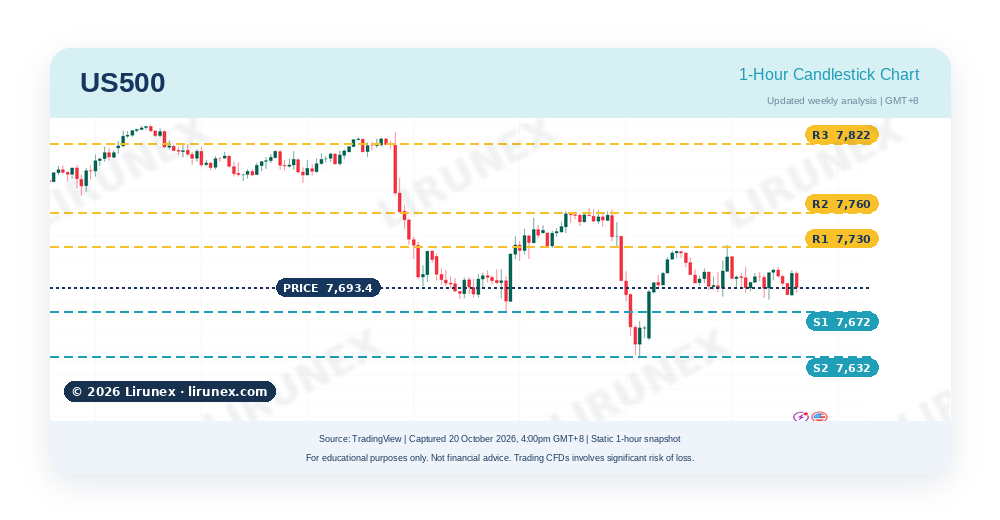
1-hour market analysis: the one-hour chart printed lower highs at 7,760 and 7,730, bounced from 7,632 on Friday and has held 7,672 to 7,730 since: a pause, not yet a turn.
- Trend: US500 at 7,693.4 (20 October 2026, 4:00pm GMT+8), weekly uptrend under test, one-hour downtrend fading.
- Resistance: 7,730, then 7,760 and 7,822.
- Support: 7,672, then 7,632 and 7,560.
- Catalyst to watch: Netflix and SpaceX on Wednesday 4:00am GMT+8, Meta and Tesla on Thursday from 4:00am.
Chart discussion: traders may monitor whether 7,672 holds through Netflix and whether the index closes above 7,760 after Meta and Tesla.
Mentor tip: an index falling on beats is pricing the cost of growth; guidance moves it, not headlines.
Sources5Research and data references for this section · tap to view▾
Forex: EUR/USD Bounces From a 52-Week Low Into Earnings Week
EUR/USD printed a 52-week low at 1.1113 on CPI day, closed last week at 1.1240, a first weekly gain since early September, and slipped to 1.1213 on Monday as French curfews after weekend unrest weighed, with bond spreads widening toward Italy.
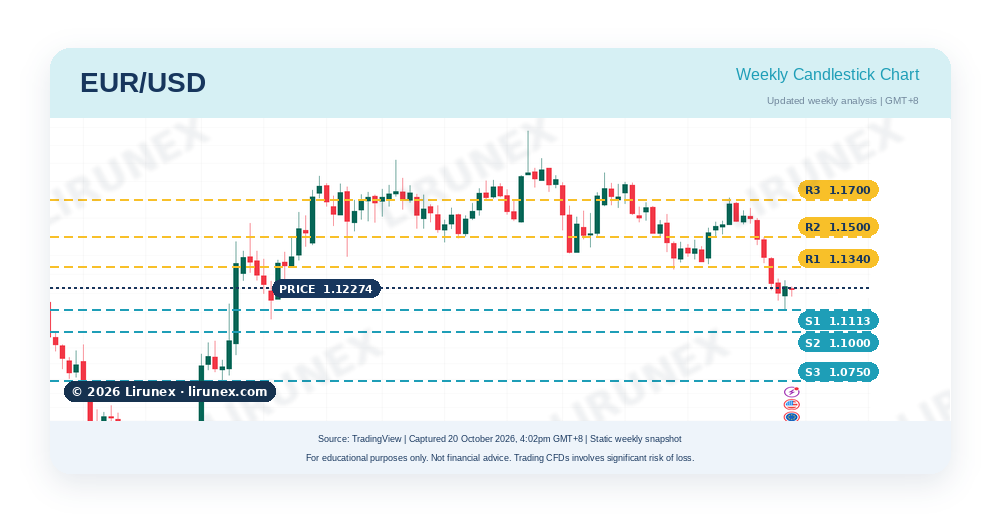
Weekly candle overview: last week's candle opened at 1.1200, fell to 1.1113 and closed at 1.1240, bullish, yet the structure stays bearish: a lower low and a high under the prior week's 1.1277. A weekly close above 1.1340 would invalidate the bias; below 1.1113 would end it.
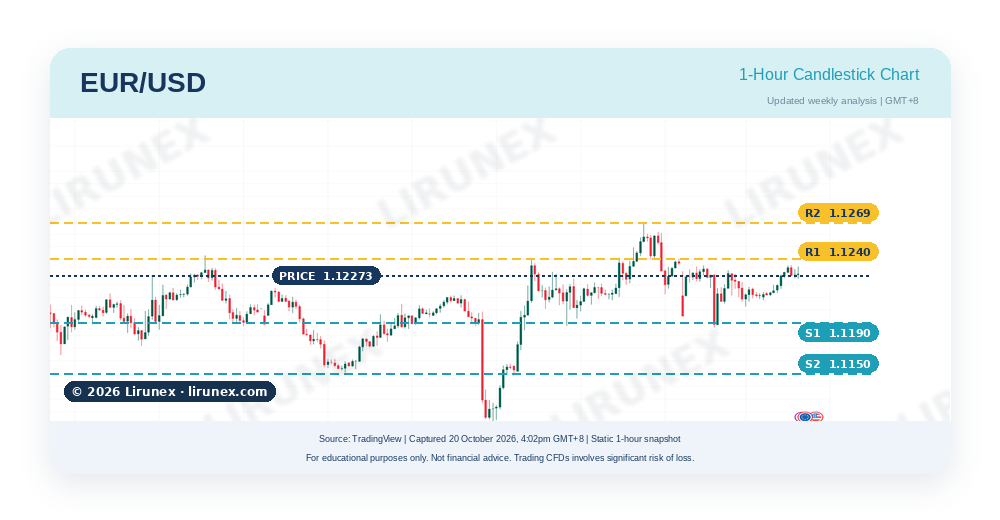
1-hour market analysis: the one-hour chart made higher lows at 1.1150 and 1.1190 and a higher high at 1.1269 as yields fell, a bounce built on the bond rally; Monday's yield rebound tested 1.1190, which held.
- Trend: EUR/USD at 1.12273 (20 October 2026, 4:02pm GMT+8), downtrend since mid-September, correcting.
- Resistance: 1.1240, then 1.1269 and 1.1340.
- Support: 1.1190, then 1.1150 and 1.1113.
- Catalyst to watch: US yields through the earnings reactions, French unrest, then Friday's flash PMIs.
Chart discussion: traders may monitor whether 1.1190 holds after the earnings results and whether it closes above 1.1240, then 1.1269.
Mentor tip: a currency rising because the other side's yields fall lasts only as long as the bond rally.
Sources6Research and data references for this section · tap to view▾
Gold (XAU/USD): Falling With Stocks, Not Against Them
Gold lost $60 in fifteen minutes on the CPI print, closed last week at 4,166 and slipped again Monday into this Q3 earnings season outlook (Lirunex's comparison of gold and oil).
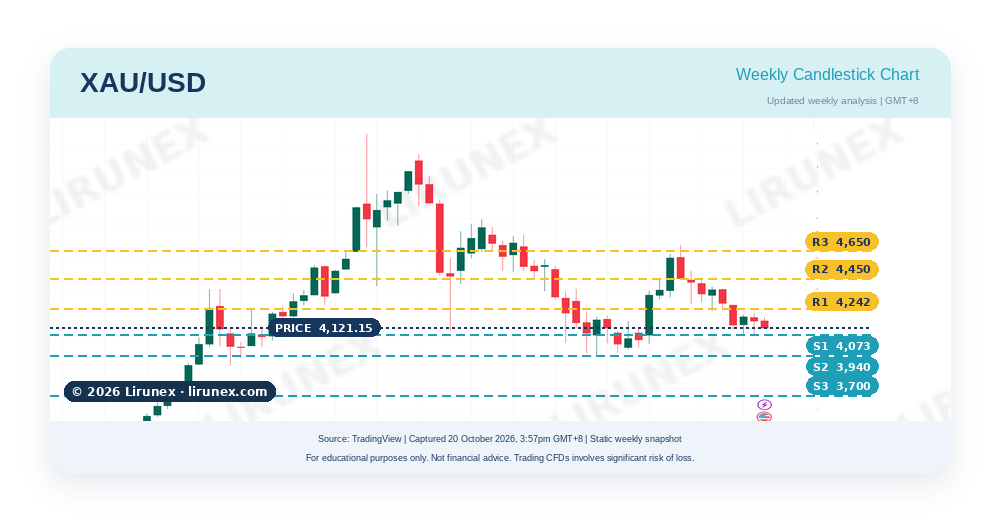
Weekly candle overview: last week's candle opened at 4,194, spiked to 4,217, fell to 4,073 and closed at 4,166; two overlapping weeks under the September high make a range, not a trend; this week opened red. A weekly close above 4,242 would turn the structure up; below 4,073 would resume the downtrend.
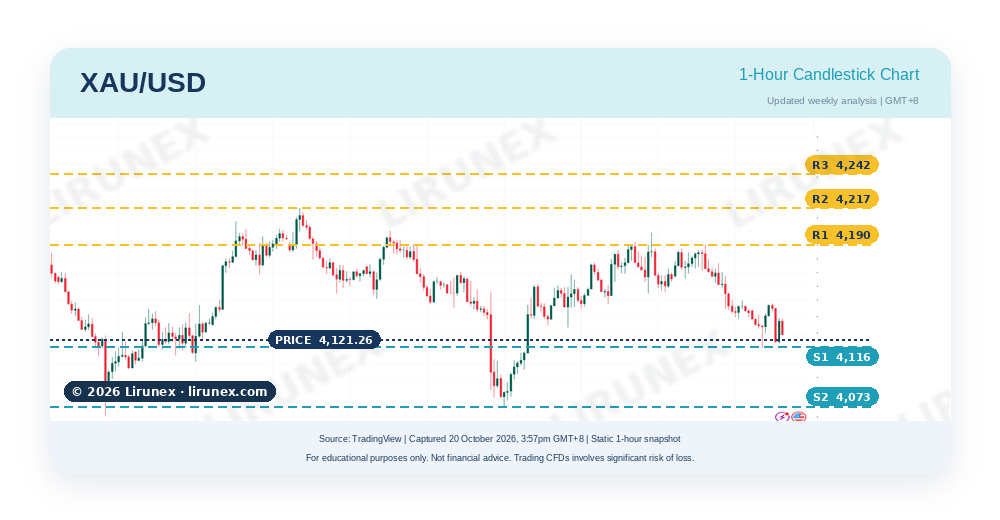
1-hour market analysis: the one-hour chart recovered from 4,073 to 4,199 on Thursday, then printed lower highs at 4,190 and slid to 4,116 on Tuesday morning as yields rose, returning there by the afternoon.
- Trend: gold at 4,121.26 (20 October 2026, 3:57pm GMT+8), range-bound inside a bearish weekly structure, one-hour lower highs.
- Resistance: 4,190, then 4,217 and 4,242.
- Support: 4,116, then 4,073 and 4,000.
- Catalyst to watch: the 10-year yield's response to the earnings results and the PMIs.
Chart discussion: traders may monitor whether 4,116 holds and whether gold closes above 4,190 as the Q3 earnings season outlook unfolds.
Mentor tip: gold fell with stocks because both were sold on yields; it hedges again only when yields fall on growth fears.
Sources6Research and data references for this section · tap to view▾
WTI Crude Oil: A 10% Week Breaks the Downtrend
WTI settled last week at 101.41, up 10.4%, on Hormuz attacks and Houthi missiles at Saudi Arabia; the expiring November contract settled at 103.66 on Monday with Brent at 109.55 (Lirunex's guide to geopolitical events and market impact).
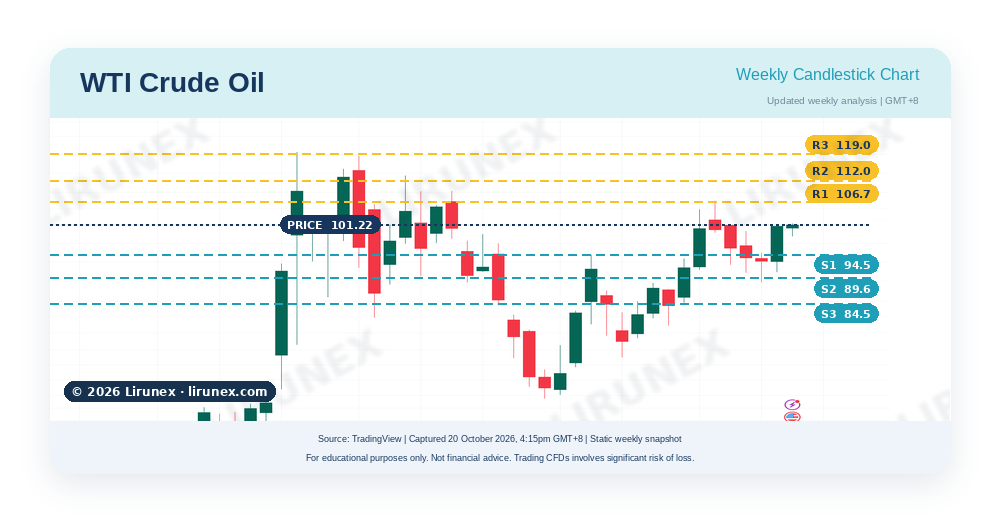
Weekly candle overview: last week's candle opened at 91.83, ranged 89.61 to 101.90 and closed at 101.41, a higher high and higher low ending four weeks of lower highs since the September peak near 106.7. A weekly RSI near 77 says the move is stretched: a close below 94.5 would mark it temporary, above 106.7 a new leg.
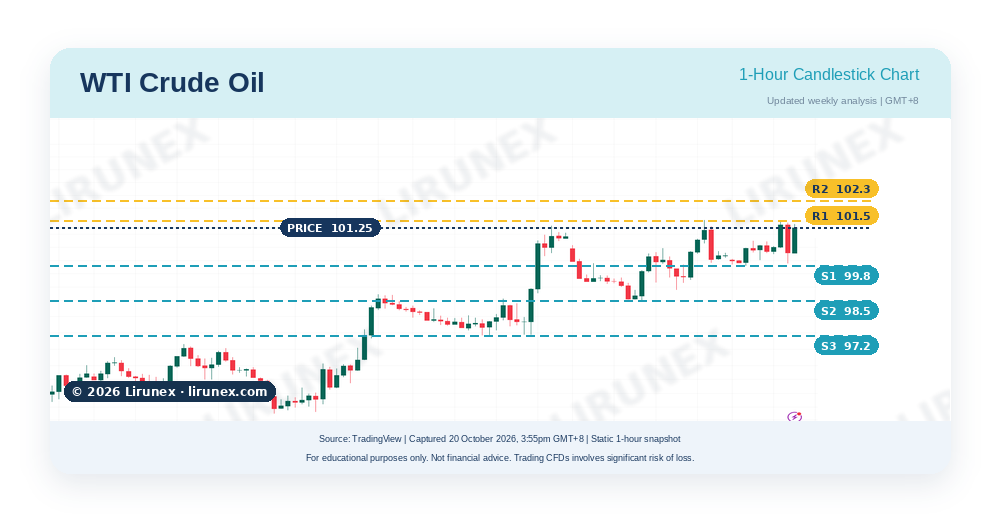
1-hour market analysis: the one-hour chart has made higher lows for six sessions, the last at 97.2, 98.5 and 99.8, while the highs at 101.5 and 102.3 have not extended since Friday: a flat top over rising lows.
- Trend: WTI at 101.25 (20 October 2026, 3:55pm GMT+8, Lirunex feed; the November futures contract settled at 103.66 on Monday before expiring; later contracts trade lower), uptrend.
- Resistance: 101.5, then 102.3 and 106.7.
- Support: 99.8, then 98.5 and 97.2.
- Catalyst to watch: Hormuz and Saudi headlines, any US-Iran de-escalation from Tuesday's Pakistani mediation in Tehran, the Russian sanctions waiver, then Wednesday's EIA report at 10:30pm GMT+8.
Chart discussion: traders may monitor whether 99.8 holds through the earnings reactions and whether 102.3 breaks.
Mentor tip: after a 10% week, the Brent to WTI spread, not direction, shows how much of the move is fear.
Sources8Research and data references for this section · tap to view▾
Key Takeaway
The conclusion of this Q3 earnings season outlook: guidance from Netflix, Meta and Tesla, not the beat rate, decides whether last week's pullback was correction or reversal.
- The 10-year yield fell on fear, not growth; Monday's rebound to 5.14% already pressed gold and EUR/USD.
- US500 is the swing instrument of this Q3 earnings season outlook: weekly trend still up, daily turned down, Monday's rebound unconfirmed.
- What could change the outlook: a Meta capital-spending shock, a Tesla margin surprise, a US-Iran de-escalation, or a Hormuz headline sending WTI through 106.7.
Trading Education Takeaway
The dominant weekly direction in this Q3 earnings season outlook is mixed: only WTI has all three timeframes aligned, US500 an uptrend under test, EUR/USD and gold corrections inside downtrends. A pullback holds the last swing, a reversal breaks it on a close; this week's closes will show which.
Frequently Asked Questions
What does this Q3 earnings season outlook expect for S&P 500 profits?
FactSet's blended estimate in this Q3 earnings season outlook is 29.0% third-quarter earnings growth and 12.6% revenue growth, with 84% of early reporters beating.
When do Netflix, Tesla and Meta report in GMT+8?
Netflix and SpaceX about 4:00am on Wednesday 21 October; Meta and Tesla from about 4:00am on Thursday 22 October, all after the US close.
Why did stocks fall last week if most companies beat?
Because the market priced the cost of AI investment rather than the quarter's profit while hot inflation lifted hike odds.
Are the support and resistance levels in this article trading signals?
No. They are reference levels from the chart cards in this Q3 earnings season outlook, for education only; none guarantees a bounce or break.
Sources and References
Sources36Research and data references for this section · tap to view▾
Ready for the Market's Next Move?
Follow this week's earnings, flash PMIs and oil headlines alongside Lirunex's US PMI recap, and practise observing how US500, EUR/USD, gold and WTI react around each report with a free Lirunex demo account, within a simulated environment. Open a live account once you feel ready and understand the risks involved. Demo conditions and results may differ from live trading.
Open Free Demo Account Open Live Account
Risk Disclaimer: This content is for educational and informational purposes only and does not constitute investment advice. Forex and CFD trading involve significant risk of loss and may not be suitable for all investors. Past performance is not indicative of future results. High impact events may cause sharp volatility, wider spreads and sudden price movements. Please understand the risks before trading. Market data as of 20 October 2026, 4:02pm GMT+8; Monday closes from Investrade and Newsquawk; chart cards from Lirunex-feed TradingView captures, 20 October, 3:55pm to 4:15pm GMT+8.