


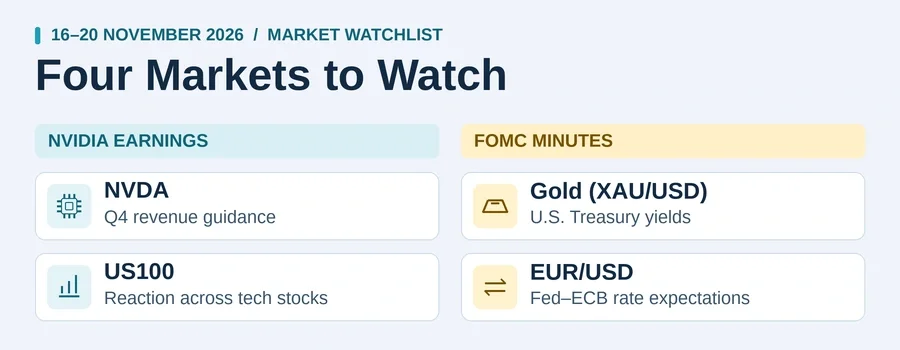
This Nvidia earnings preview covers two events 21 hours apart: Nvidia's third-quarter results at 6:00am GMT+8 on Wednesday 18 November, and the October Fed minutes at 3:00am GMT+8 on Thursday. One tests the AI trade's valuation; the other shows how close the committee came to hiking. Moreover, Nvidia reports in a bear market under an interim chief executive, with a December hike fully priced.
Weekly Overview
Nvidia guided third-quarter revenue to about $108.0 billion; consensus is near $109 billion and $2.47 a share; thus the bar is the guide, not the beat (Lirunex's Q3 earnings season outlook explains why). Nvidia stock closed Friday at 162.85, 32% below its October record; indeed it fell 12.8% on the week after Jensen Huang's resignation on 12 November. Meanwhile, the Fed held at 3.75% to 4.00% with two dissents for a hike; CPI printed hot, October PPI rose 6.5% on the year, the fastest since 2022, the 10-year yield ended at 5.15%, and futures price a December hike at about 89%.
Last week on the Lirunex weekly charts
Similarly, the weekly charts set the ground for this Nvidia earnings preview (the series sits in the Lirunex News and analysis hub): NVDA closed at 162.85, two dollars above 161.0; US100 near 28,120 on the CFD, above the 26,250 November low; gold at 3,886, below the 3,943 July low; EUR/USD at 1.1020, below 1.1108.
Sources10Research and data references for this section · tap to view▾
- NVIDIA: Second Quarter Fiscal 2027 Results, Form 8-K
- Investing.com: Nvidia Schedules Q3 Fiscal 2027 Earnings Call for 17 November
- MarketBeat: NVIDIA Q3 2027 Earnings Date and Estimates
- FinanceFeeds: Nvidia Stock at $215 After Microsoft's Beat and Alphabet's $51 Billion Capex Quarter
- Startup Fortune: Alphabet Shares Suffer Worst Day Ever as Wall Street Doubts AI Payoff
- Admirals: Fed Rate Decision 28 October 2026, Hawkish Hold in 10-2 Vote
- BLS: Producer Price Index, October 2026
- Investing.com: Fed Rate Hike Odds in December at 88% After Hot CPI, CME FedWatch
- CappNotes: Closing Look, Friday 13 November 2026
- Lirunex: Q3 Earnings Season Outlook, Tesla, Meta and Netflix Test a Shaken US500
Nvidia Earnings Preview: The Four Lines That Decide the Reaction
Nvidia reports at about 1:20pm Pacific on Tuesday 17 November, that is, 6:00am GMT+8 on Wednesday (Lirunex trading hours shows when the US100 CFD starts pricing it); for a $3.9 trillion company the reaction is an index event; therefore this Nvidia earnings preview treats it as an index catalyst first.
The Guide, the Margin and China
The first line in any Nvidia earnings preview is revenue against the $108 billion guide: the beat is assumed. The second is gross margin, guided to 74.0%; the third is the fourth-quarter guide, where anything short of about $120 billion reads as deceleration; the fourth is China, where no Data Center revenue is assumed. Finally, options price an 8.3% move, the widest in two years.
Nvidia CEO Question: What the Board Decides Before the Call
The fifth line in this Nvidia earnings preview is the Nvidia CEO change. On 12 November Jensen Huang resigned as chief executive and director; Colette Kress, the chief financial officer, is interim chief executive, and Harvey Jones is the first board chair. Nevertheless, the 17 November date was reaffirmed. However, by 16 November no permanent appointment had been made; the Financial Times reported that Huang has discussed a return with allies, while Treasury Secretary Scott Bessent said the board should look outside the company. In short, the call is Kress's first, and succession questions can move the stock as much as the numbers.
Why the FOMC Minutes Matter More Than Usual
Because of two dissents and a hot CPI, the minutes in this Nvidia earnings preview week are read for the count: how many participants wanted a hike, and whether anyone raised the half point Governor Waller put on the table. Lirunex's Fed meeting preview explains the yield channel; as a result, hawkish minutes 21 hours after a strong print can reverse the first reaction.
Nvidia earnings preview scenario grid: possible first reactions (educational, not signals)
Scenario 1Beat and Q4 guide above $120bn; minutes hawkish but no 50bp talk (base case)▾
Scenario 2In-line guide or margin miss; minutes hawkish▾
Scenario 3Strong beat and guide; minutes show hike talk fading▾
Scenario 4Interim CEO's first call raises succession or roadmap doubts▾
Nvidia earnings preview week schedule at a glance (GMT+8)
Tuesday 17 Nov3 events▾
Wednesday 18 Nov4 events▾
Thursday 19 Nov4 events▾
Friday 20 Nov1 event▾
Sources5Research and data references for this section · tap to view▾
- Finance Calendar: Walmart Earnings November 2026
- Finance Calendar: Japan CPI November 2026
- Federal Reserve: FOMC Meeting Calendars, Statements and Minutes
- FXEmpire: The Week Ahead, Nvidia Earnings and Anthropic IPO Test the AI Trade
- Reuters via 104.9 The Wolf: Japan Core Inflation Seen Above BOJ Target in October
Markets That May React
Each instrument is read weekly first, then short-term; where gold and the index disagree, Lirunex's guide to risk-on and risk-off explains why.
NVDA: The Share at the Centre of This Nvidia Earnings Preview
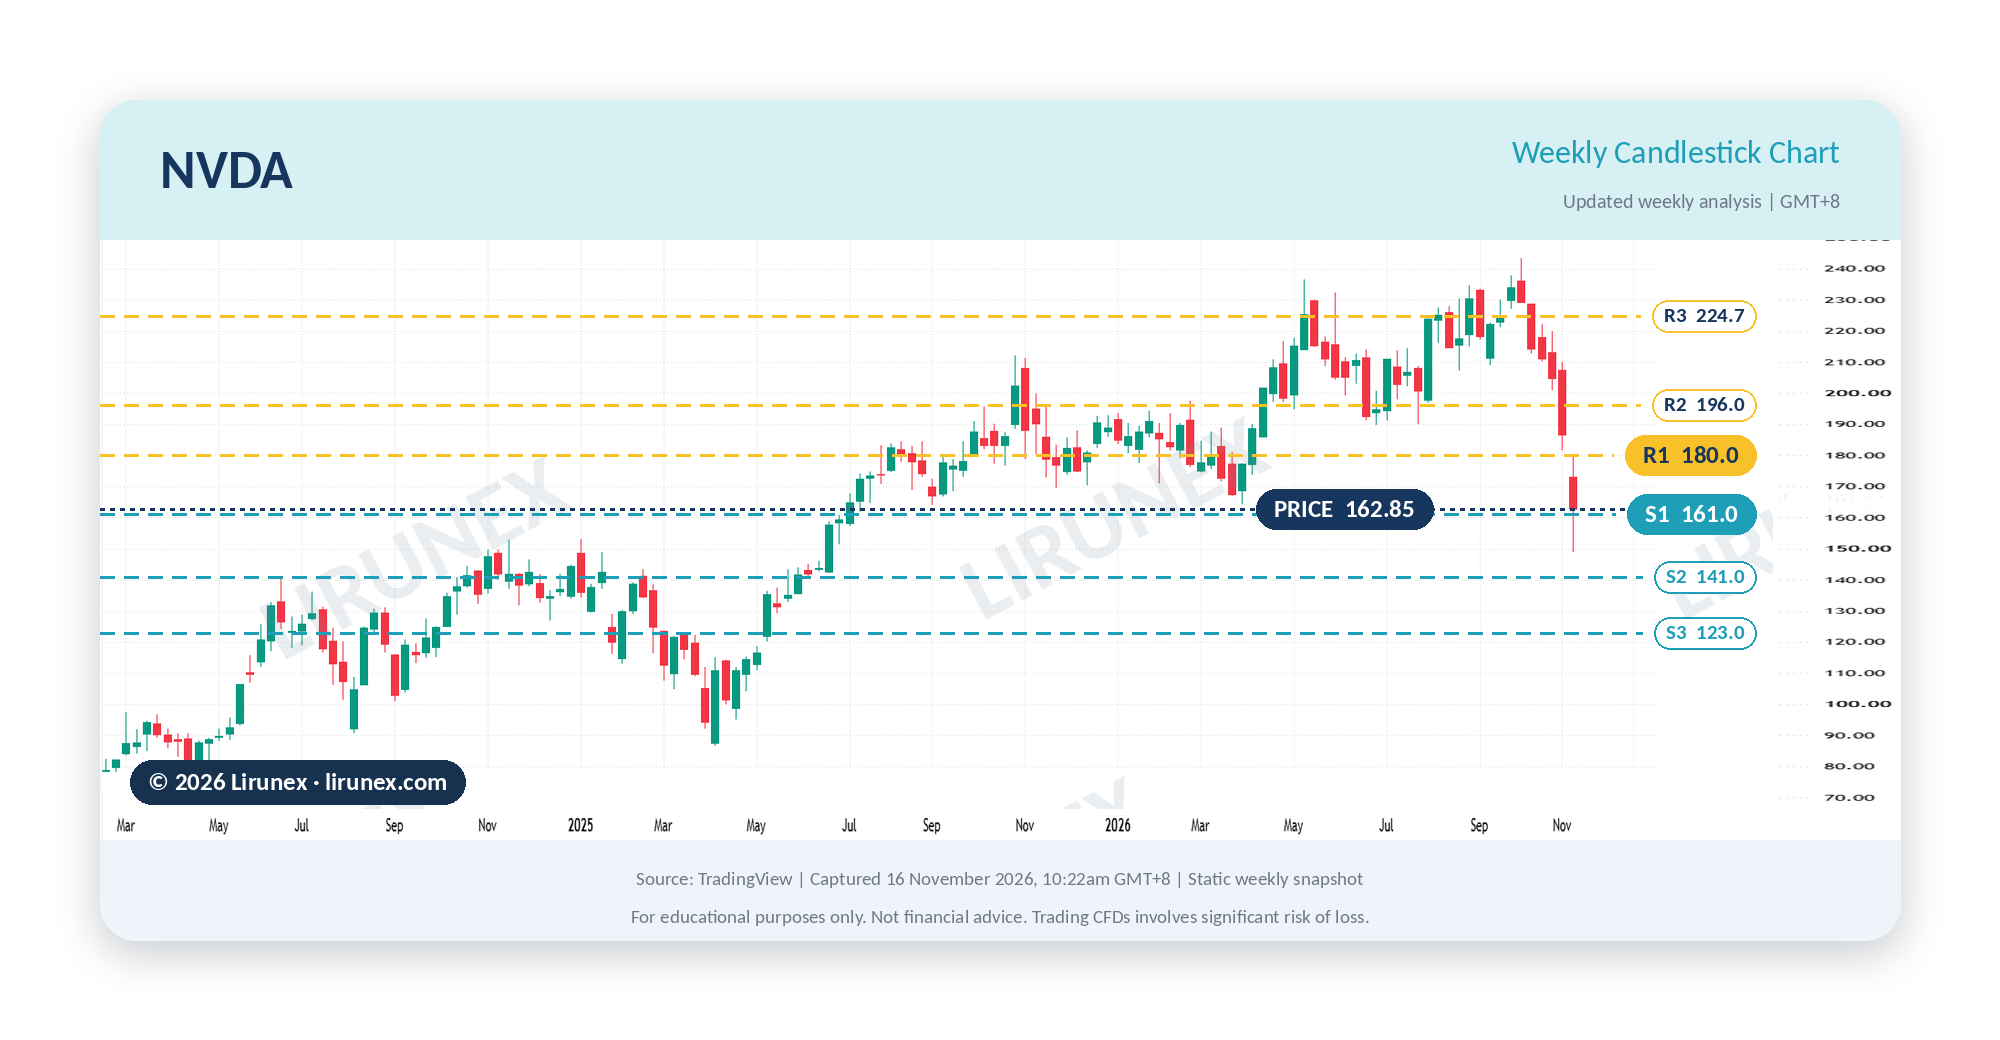
Above all, NVDA is the instrument this Nvidia earnings preview is about: a bear market since the October record, a 16% intraday plunge the day Huang resigned, and a 162.85 weekly close, down 12.8%, the sixth red week in a row.
Timeframe alignmentNVDA, week of 9 to 13 November 20265 rows · tap to open▾
Weekly candle overview: specifically, the 9 to 13 November candle is a wide red body closing near its low at 162.85. Below 161.0 the bear market extends toward 141.0; conversely, above 196.0 the selling was a shakeout.
NVDA daily chart and key levels before Nvidia earnings
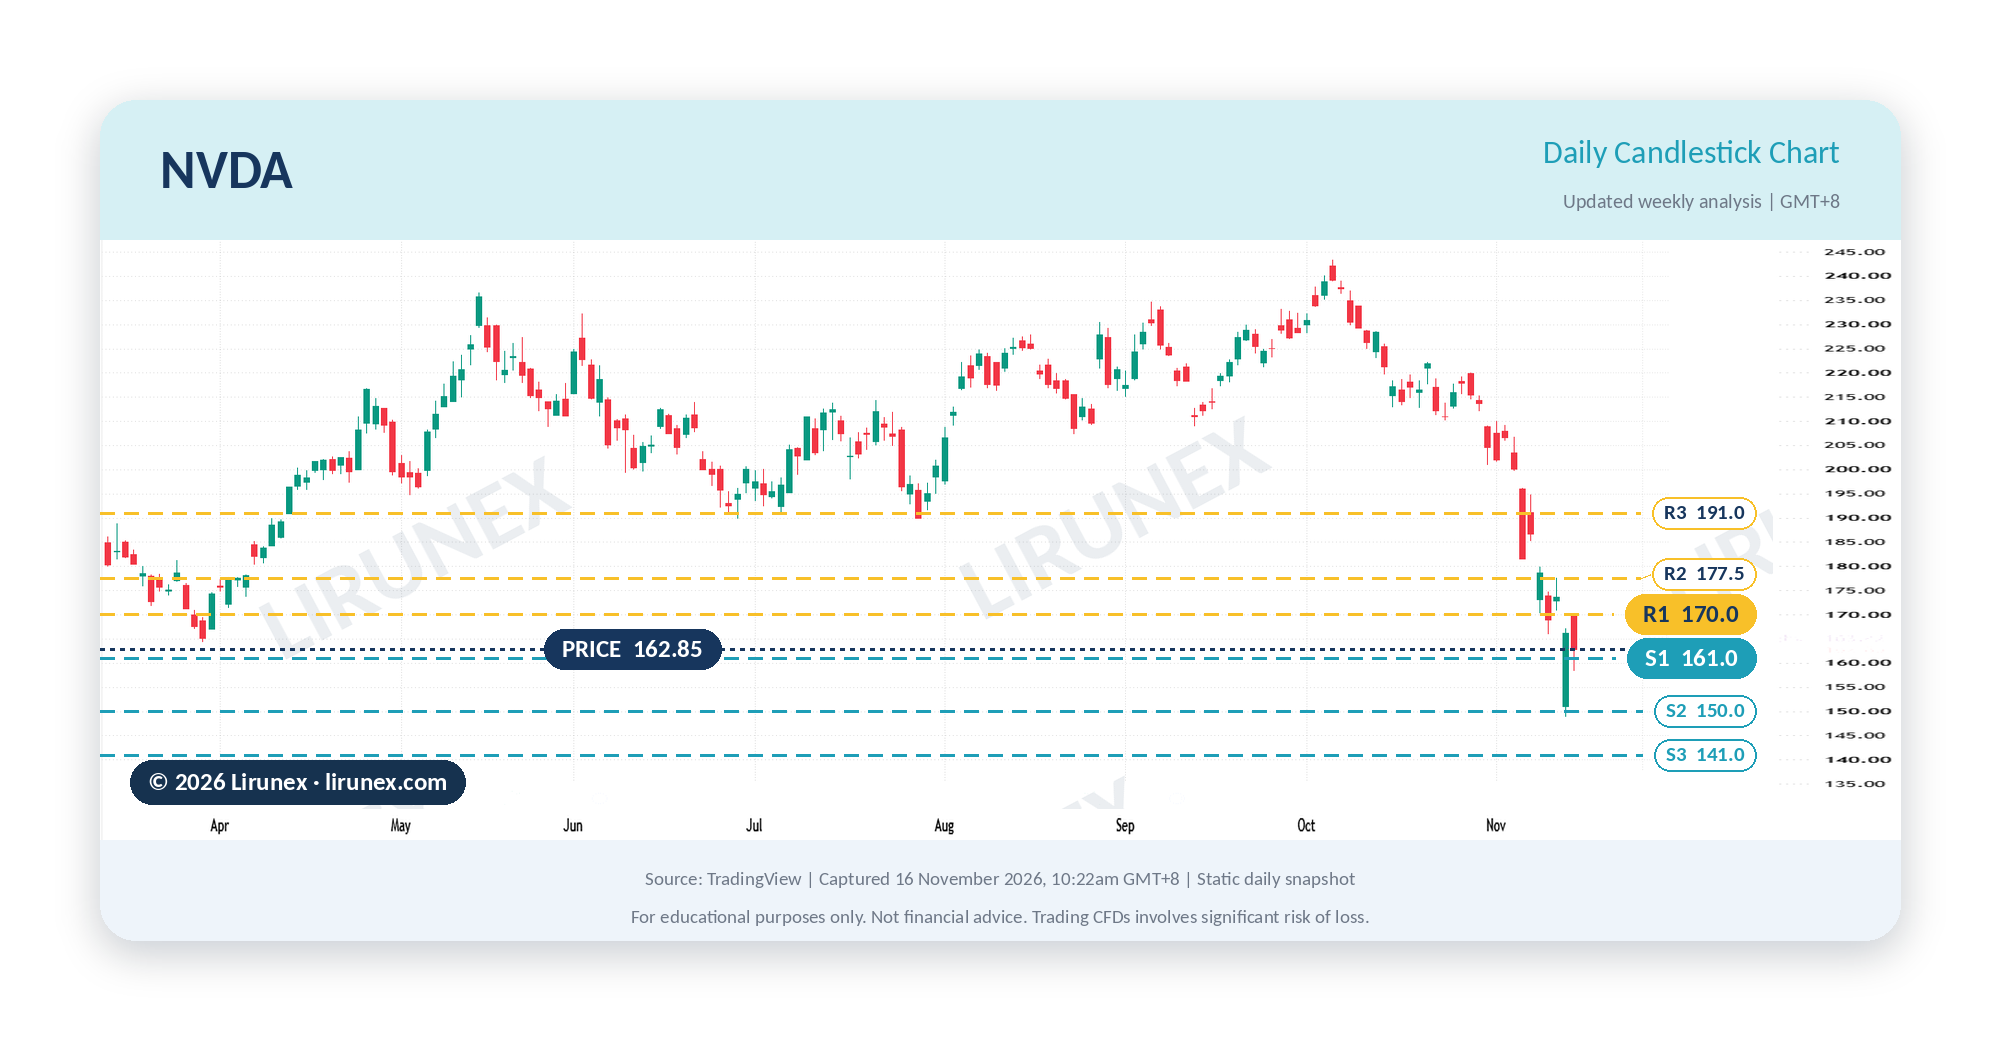
Daily market analysis: since the 12 November gap the share has made lower highs below 170.0. In this Nvidia earnings preview the share CFD gaps on headlines; therefore the daily chart is read for where the gaps fill.
- Trend: NVDA at 162.85 (13 November close), downtrend since the October record.
- Resistance: 170.0, then 177.5 and 191.0.
- Support: 161.0, then 150.0 and 141.0.
Chart discussion: accordingly, traders may watch whether 161.0 holds into the report and whether a strong guide reclaims 177.5.
Mentor tip: size a single share for the gap, not the trend.
Sources8Research and data references for this section · tap to view▾
- NVIDIA: NVIDIA Announces CEO Transition, 12 November 2026
- Theta: NVDA Q3 FY2027 Earnings Estimates and History
- The Motley Fool: Should You Buy Nvidia Stock Before 17 November?
- Fortune: Bessent on Nvidia Leadership, 15 November 2026
- BigGo Finance: Options Market Prices an 8.3% Swing for Nvidia's First Call Without Huang
- American Bazaar: Nvidia Rebounds Despite Wall Street Downgrades
- Al Jazeera: Nvidia Shares Plunge Amid Reports Board to Discuss CEO Huang's Future
- Lirunex: Q3 Earnings Season Outlook, Tesla, Meta and Netflix Test a Shaken US500
US100: The Index Inside This Nvidia Earnings Preview
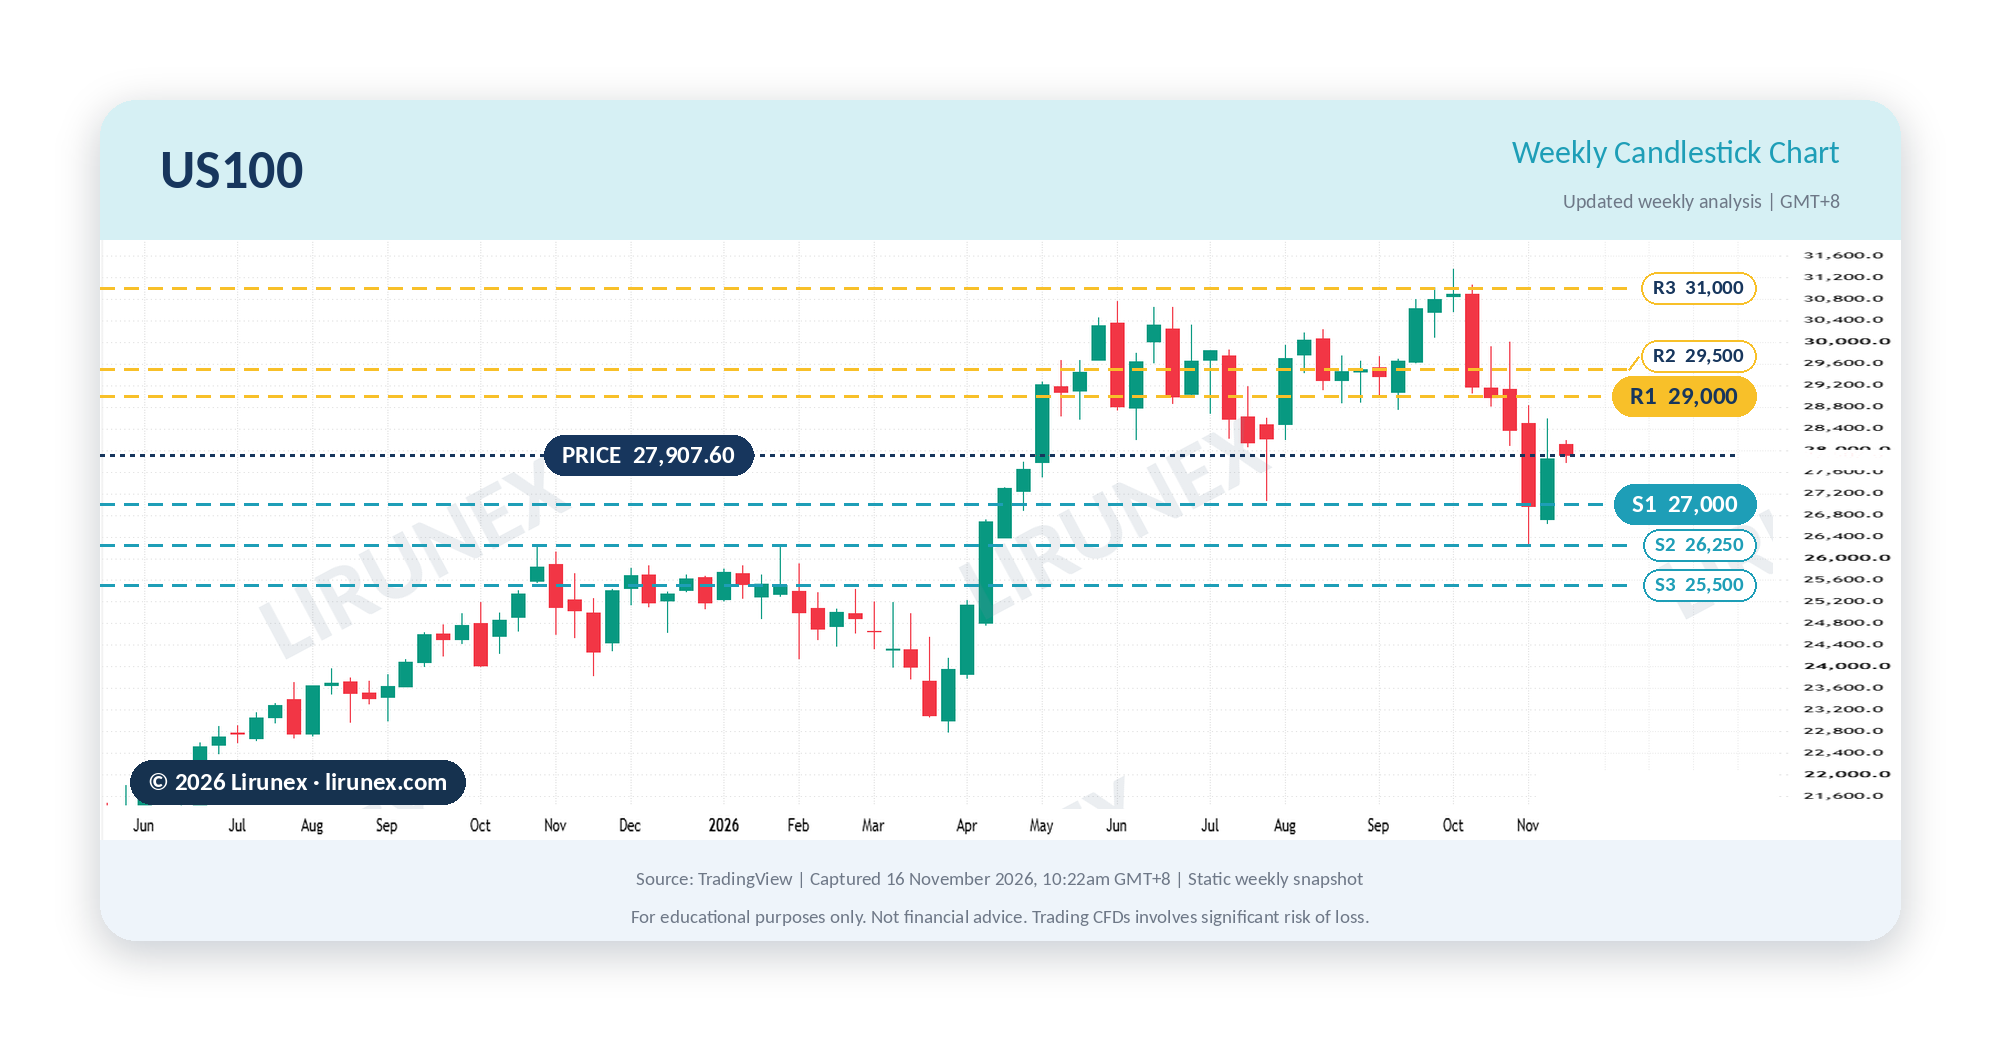
US100 is where the Nvidia earnings preview plays out at index level: the cash index closed the week up 3.5% at 27,944, near 28,120 on the CFD, as AMD and Broadcom absorbed the Nvidia money; in other words, the AI trade is rotating rather than leaving (Lirunex's gold versus oil comparison shows the same logic).
Timeframe alignmentUS100, week of 9 to 13 November 20265 rows · tap to open▾
Weekly candle overview: the 9 to 13 November candle is green, closing near 28,120 after four red weeks, the first green week of the correction. Above 29,500 the uptrend resumes; on the other hand, below 26,250 the correction becomes a downtrend.
US100 4-hour chart and key levels before Nvidia earnings
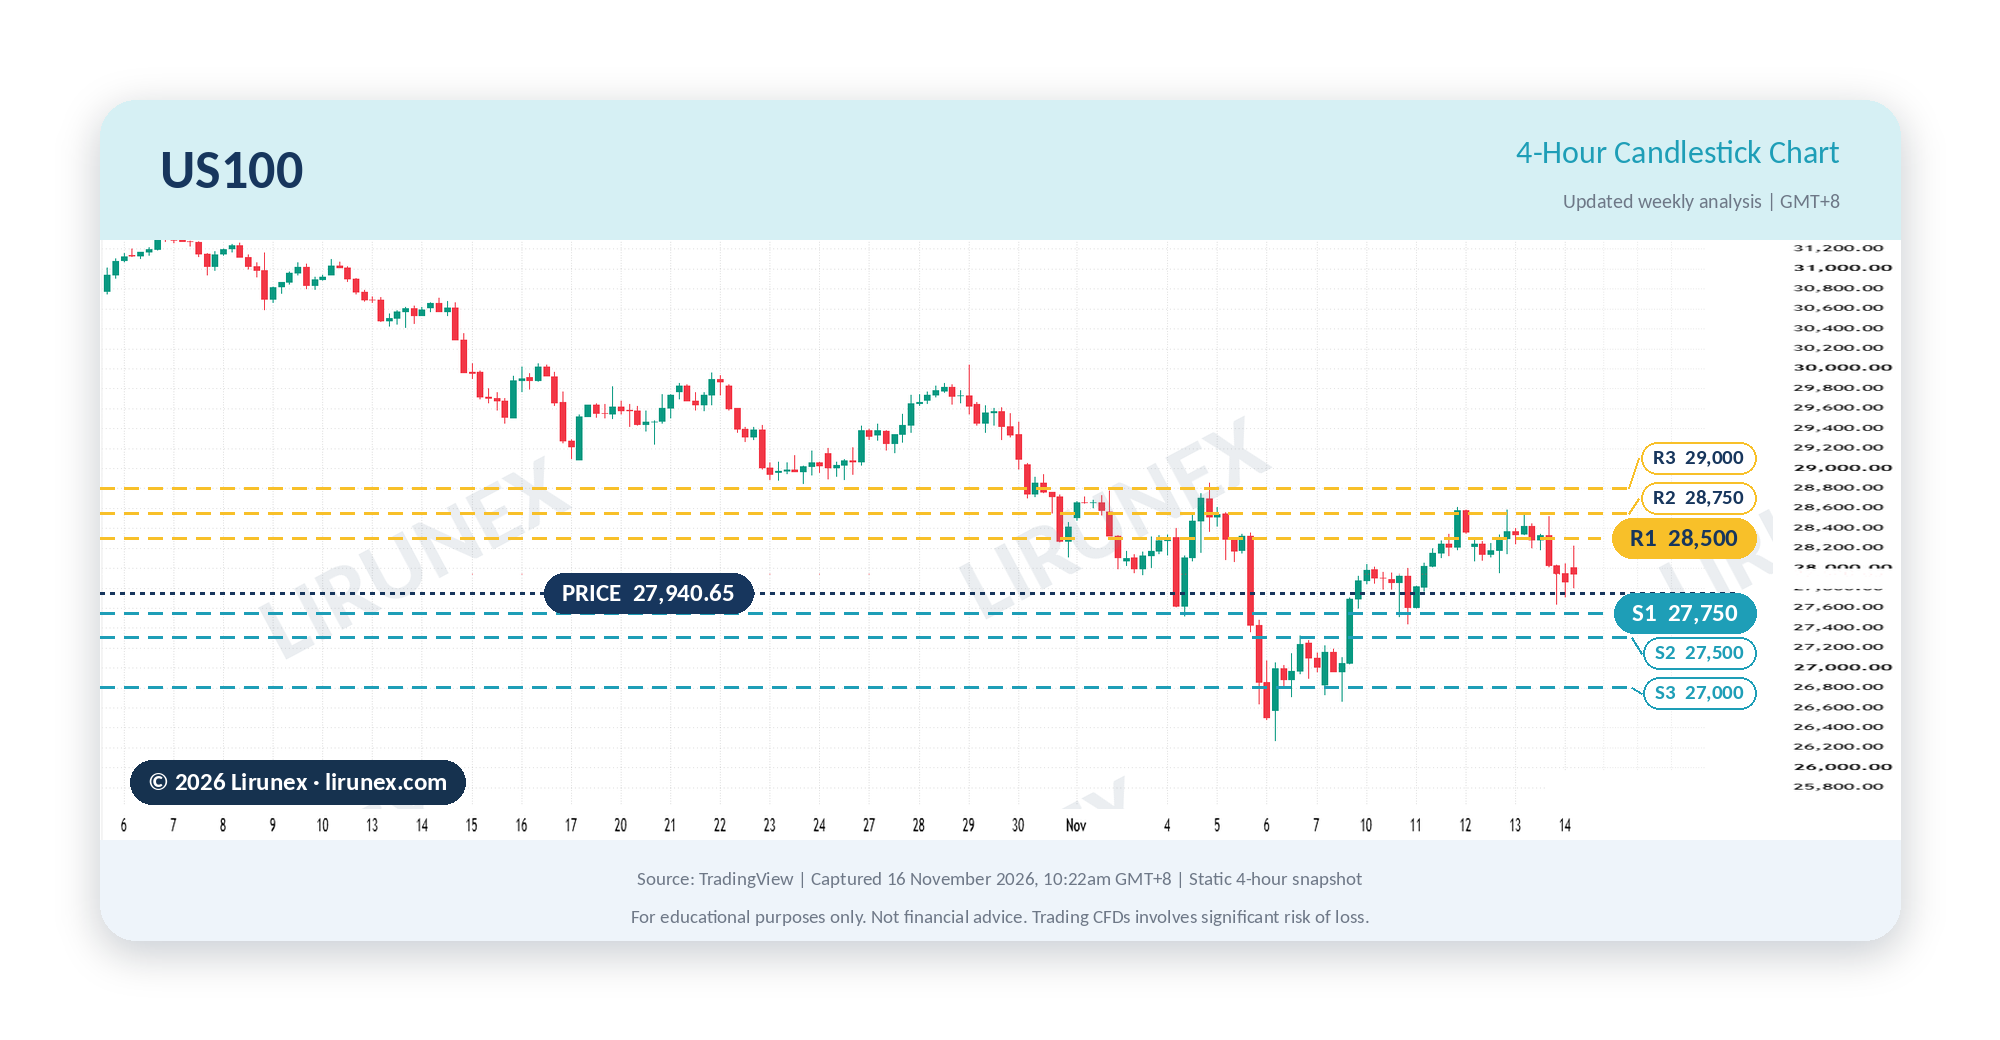
4-hour market analysis: since the CPI week the index has held between 27,500 and 28,500 and opened Monday near 27,940. The report at the centre of this Nvidia earnings preview lands at 6:00am GMT+8; the first hour sets the range; afterwards, the minutes decide whether it holds.
- Trend: US100 at 27,941 (16 November, 10:22am GMT+8), uptrend in correction.
- Resistance: 28,500, then 28,750 and 29,000.
- Support: 27,750, then 27,500 and 27,000.
Chart discussion: hence traders may watch whether 27,750 holds through the Wednesday Asian session and whether 28,500 is reclaimed after the minutes.
Mentor tip: when one stock is the index, trade the index reaction, not the headline.
Sources4Research and data references for this section · tap to view▾
Gold (XAU/USD): The Minutes, Not Nvidia
Gold reads the second half of this Nvidia earnings preview: it moves on how many Fed participants wanted a hike (Lirunex's gold FOMC recap shows how the last two meetings traded); the 10-year above 5% pushed gold through the 3,943 July low to a 3,886 weekly close, and Monday opened near 3,878.
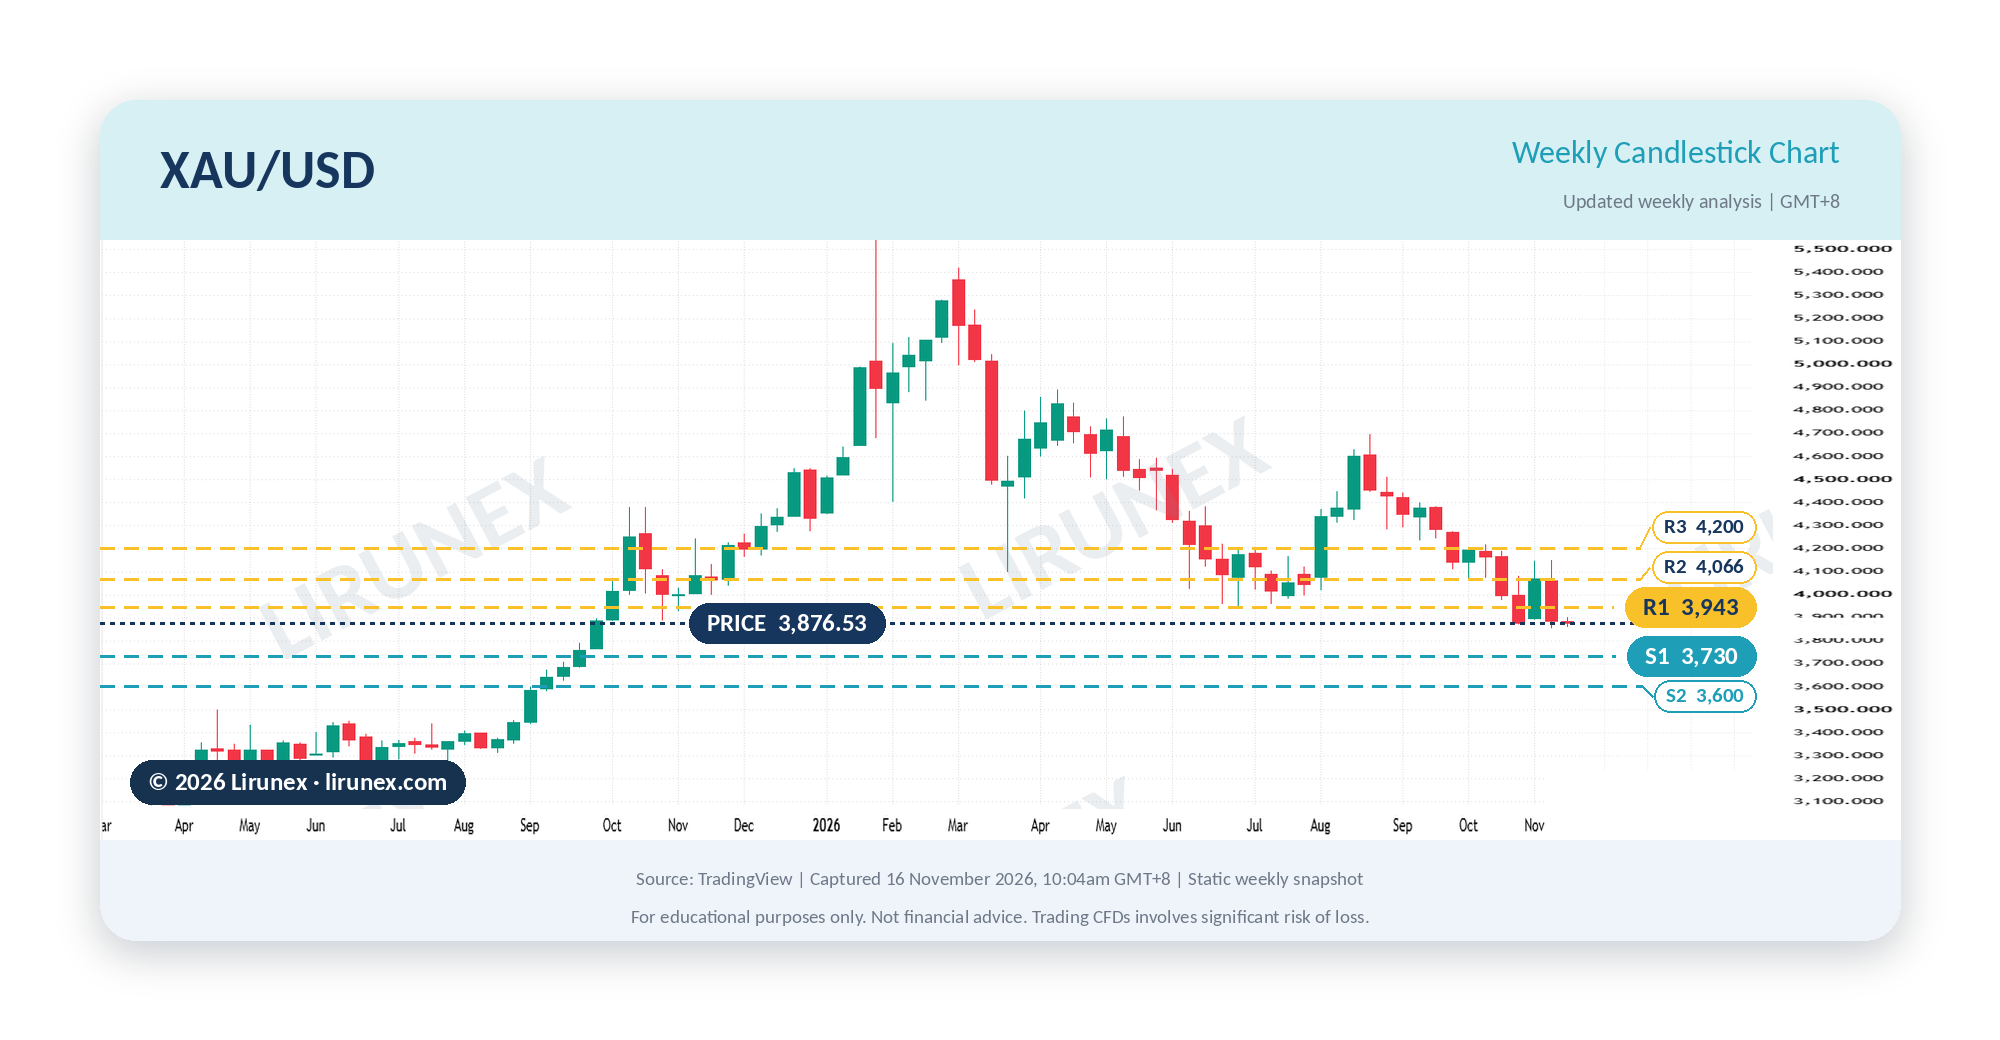
Timeframe alignmentGold (XAU/USD), week of 9 to 13 November 20265 rows · tap to open▾
Weekly candle overview: the 9 to 13 November candle is a wide red body closing at 3,886, the first weekly close below the 3,943 July low. Back above 3,943 the break is false; in contrast, below 3,730 the next reference is 3,600.
Gold 4-hour chart and key levels before the FOMC minutes
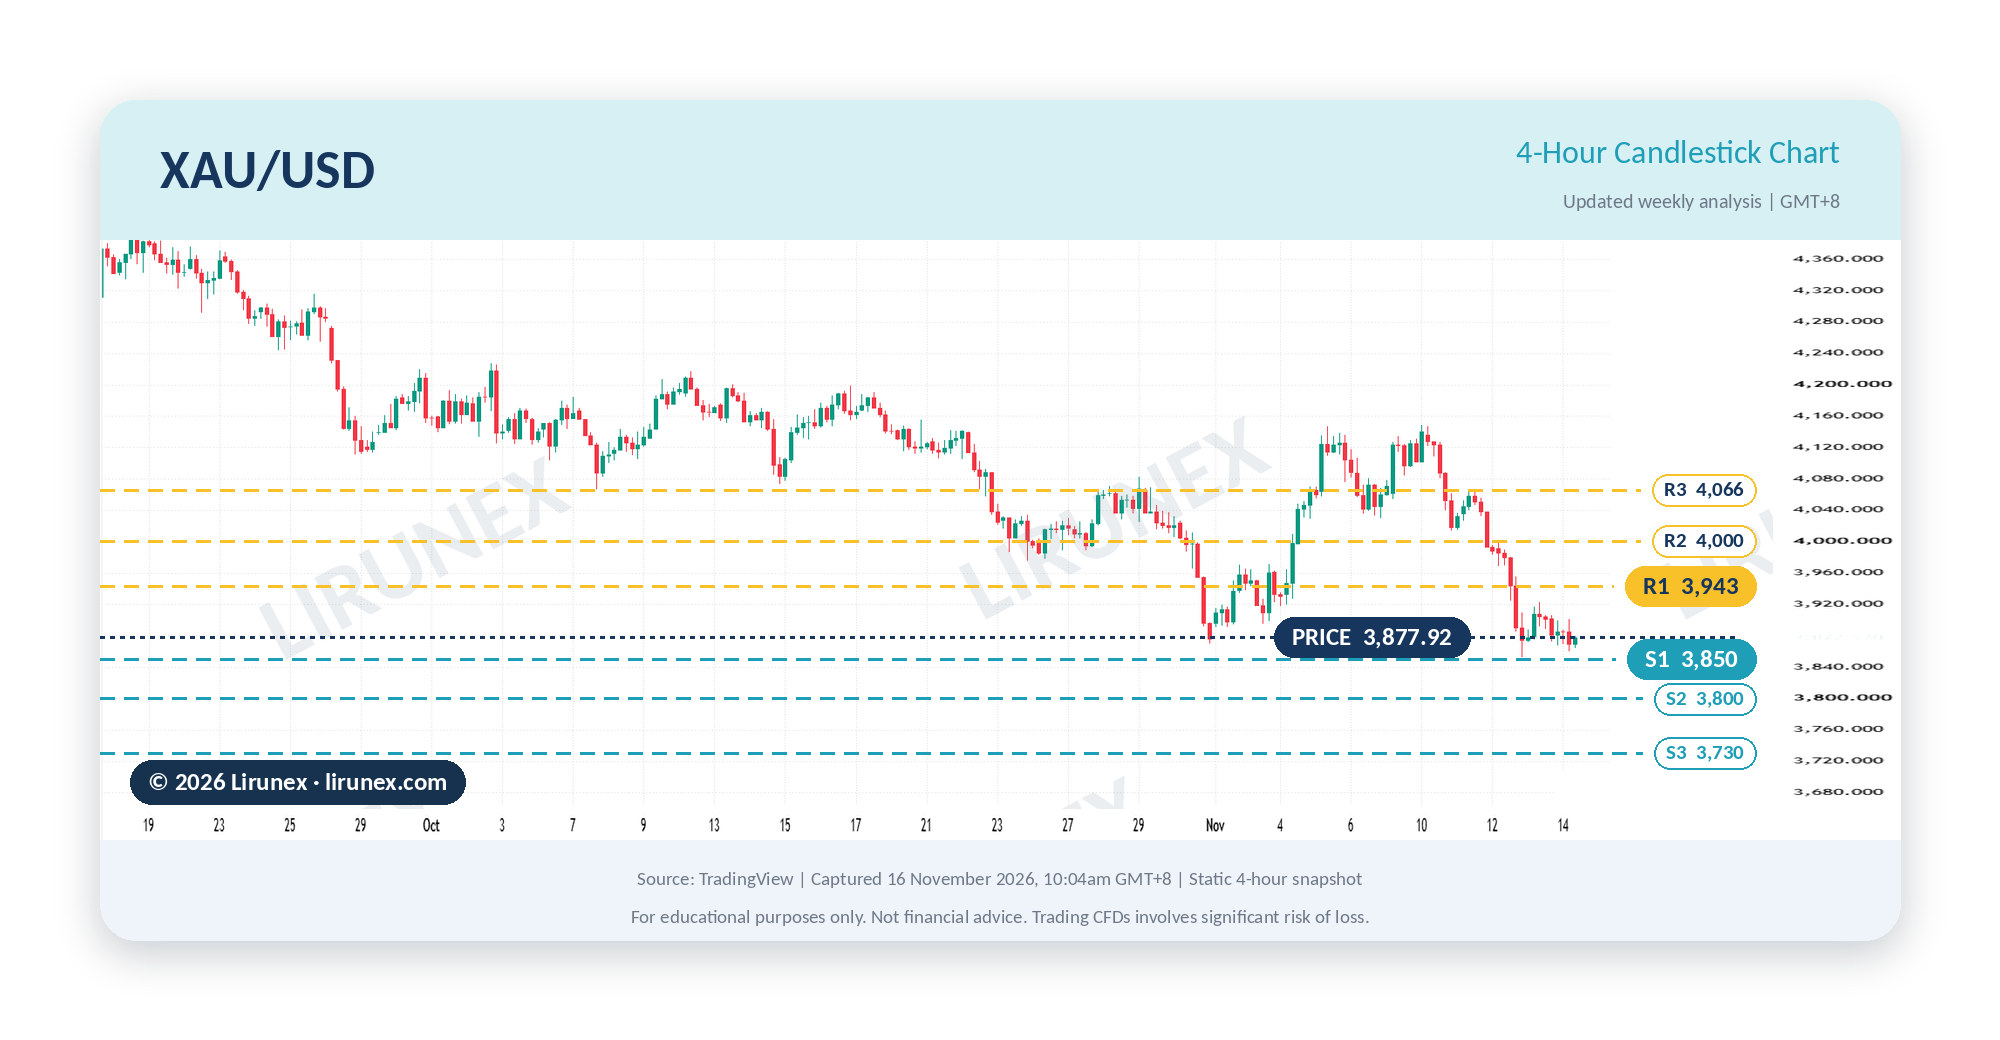
4-hour market analysis: since the CPI week gold has stepped down from 4,130 through 3,943 to 3,878, holding 3,850 so far. The Thursday 3:00am release lands in a thin session; consequently, a hawkish count can print the week's low in one candle.
- Trend: gold at 3,878 (16 November, 10:04am GMT+8), downtrend on the weekly chart.
- Resistance: 3,943, then 4,000 and 4,066.
- Support: 3,850, then 3,800 and 3,730.
Chart discussion: likewise, traders may watch whether 3,850 holds through the minutes and whether gold can reclaim 3,943.
Mentor tip: gold trades the hawk count, not the headline rate.
Sources3Research and data references for this section · tap to view▾
Forex: EUR/USD Between the Minutes and the ECB Accounts
EUR/USD enters this Nvidia earnings preview week below its old 52-week low at 1.1108, closing Friday at 1.1020 with the dollar index at 103.4; in turn, the more hawks in the minutes, the wider the rate gap into December.
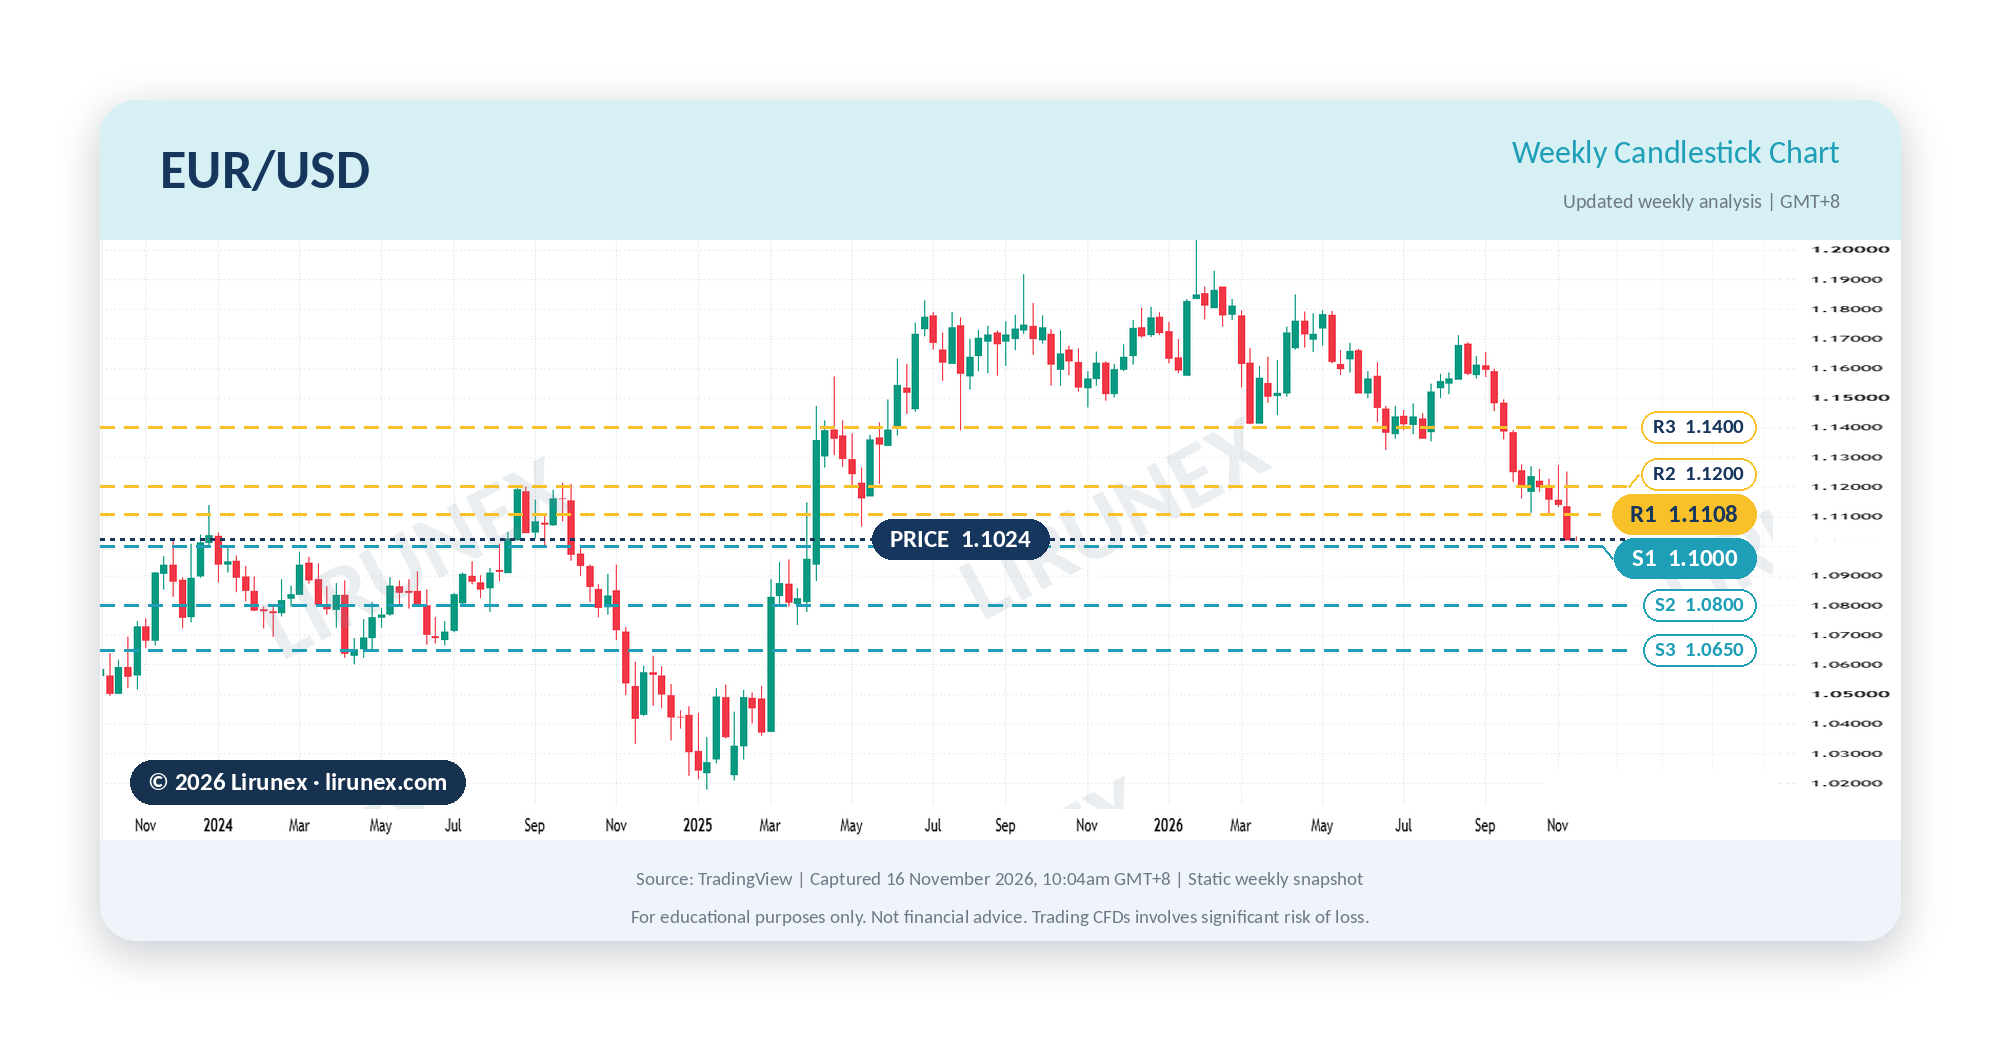
Timeframe alignmentEUR/USD, week of 9 to 13 November 20265 rows · tap to open▾
Weekly candle overview: the 9 to 13 November candle closed at 1.1020, below 1.1108. In Nvidia earnings preview terms, below 1.1108 the break is confirmed toward 1.1000; conversely, back above it is a false break.
EUR/USD 4-hour chart and key levels before the FOMC minutes
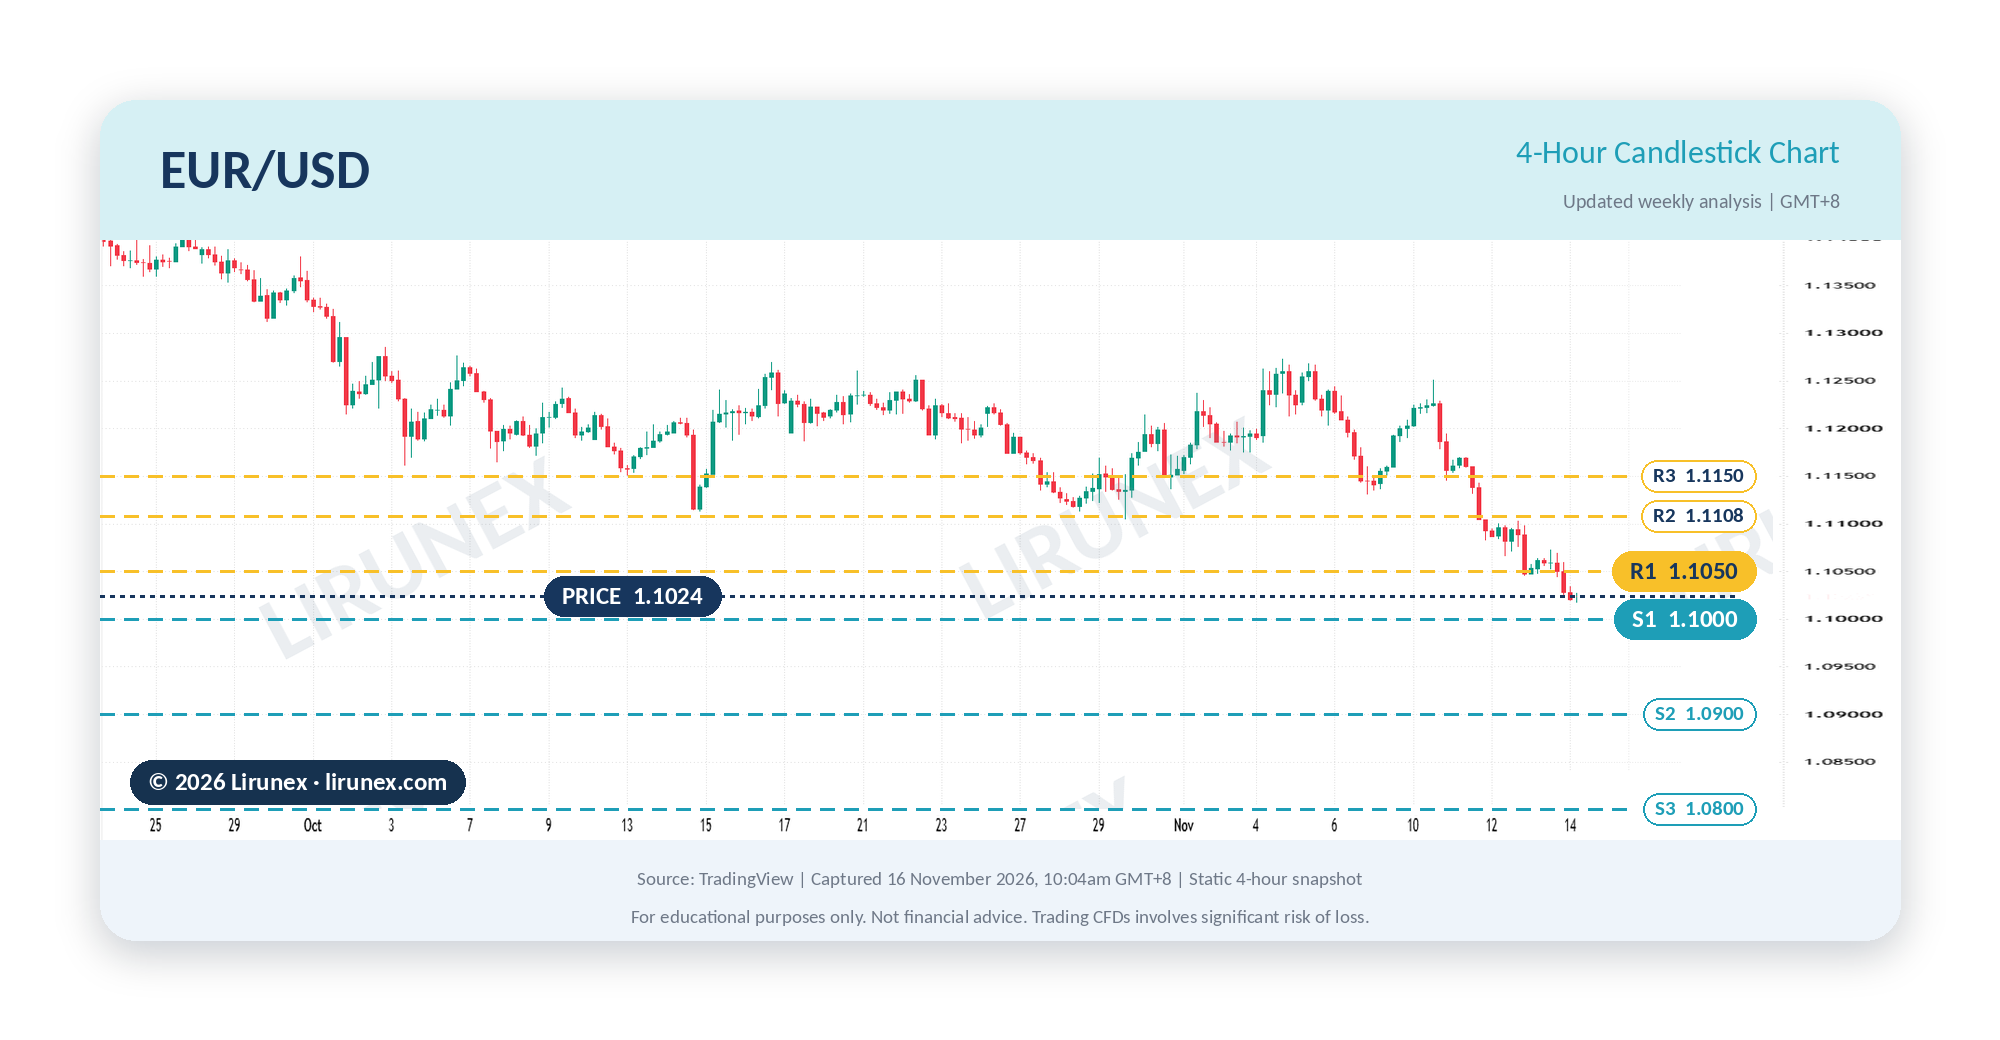
4-hour market analysis: since the CPI week the pair has made lower highs from 1.1265 and opened Monday at 1.1024, under 1.1050, which turns to first resistance. UK CPI on Wednesday moves the pair before Nvidia does; hence Wednesday's range is Thursday's reference.
- Trend: EUR/USD at 1.1024 (16 November, 10:04am GMT+8), downtrend since mid-September.
- Resistance: 1.1050, then 1.1108 and 1.1150.
- Support: 1.1000, then 1.0900 and 1.0800.
Chart discussion: equally, traders may watch whether 1.1050 is reclaimed before the minutes and whether a hawkish count opens 1.1000.
Mentor tip: in a one-way rate market, size for the surprise, not the base case.
Sources2Research and data references for this section · tap to view▾
Key Takeaway
In conclusion, this Nvidia earnings preview finds that the $108 billion guide is the bar, the fourth-quarter guide is the verdict, and the FOMC minutes decide whether the first reaction survives.
- Above all, the Nvidia earnings preview base case is a beat with a fourth-quarter guide above about $120 billion.
- Meanwhile, gold and EUR/USD carry the minutes risk in this Nvidia earnings preview week: the hawk count sets real yields and the rate gap into 9 December.
- Lastly, what could still change this Nvidia earnings preview's outlook: a China export headline, a board statement on the chief executive search, or Thursday's Anthropic debut.
Trading Education Takeaway
Overall, the dominant weekly direction into this Nvidia earnings preview is down for NVDA, gold and EUR/USD, and up in correction for US100; a pullback holds the last swing, a reversal breaks it on a close. Additionally, a tested approach: Lirunex copy trading.
Frequently Asked Questions
Nvidia earnings preview FAQ: the CEO change
Tap a question to open the answer · educational, not signals
Q1Did Jensen Huang leave Nvidia?▾
Yes. Nvidia announced on 12 November that Jensen Huang had resigned with immediate effect; however, the statement gave no reason.
Source1tap to view▾
Q2Who is Nvidia's new CEO?▾
Colette Kress, chief financial officer since 2013, is interim chief executive while the board searches for a successor; Harvey Jones is the first board chair. However, no permanent appointment had been announced by 16 November; the Financial Times reported that Huang has discussed a return with allies.
Q3Is the AI bubble bursting?▾
Not on this week's evidence: AMD, Broadcom and CoreWeave rallied as Nvidia fell; in other words, money is rotating within the AI trade; the 17 November guide is this Nvidia earnings preview's test.
Nvidia earnings preview FAQ: timing and levels
Tap a question to open the answer · educational, not signals
Q4When does Nvidia report earnings in GMT+8?▾
Tuesday 17 November at about 1:20pm Pacific, call at 2:00pm, which is 6:00am GMT+8 on Wednesday 18 November; moreover, Nvidia reaffirmed the date after the CEO change.
Q5When are the FOMC minutes released, and why does this Nvidia earnings preview pair them?▾
Thursday 19 November at 3:00am GMT+8, 21 hours after the Nvidia earnings preview event; in turn, the hawk count sets the December hike pricing.
Source1tap to view▾
Federal Reserve: FOMC Meeting Calendars, Statements and Minutes
Q6Are the support and resistance levels in this article trading signals?▾
No. Rather, they are reference levels from the chart cards in this Nvidia earnings preview, for education only.
Source1tap to view▾
Lirunex chart cards built from TradingView captures of 16 November 2026 (see the eight cards above).
Sources and References
Company, central bank and statistics sources
Sources4Research and data references for this section · tap to view▾
Market data and news sources
Sources21Research and data references for this section · tap to view▾
- Fortune: Bessent on Nvidia Leadership, 15 November 2026
- CappNotes: Closing Look, Friday 13 November 2026
- Investing.com: Nvidia Schedules Q3 Fiscal 2027 Earnings Call for 17 November
- MarketBeat: NVIDIA Q3 2027 Earnings Date and Estimates
- FinanceFeeds: Nvidia Stock at $215 After Microsoft's Beat and Alphabet's $51 Billion Capex Quarter
- HeyGoTrade: Nvidia Stock Falls 0.8% to $213.66, 29 October
- Startup Fortune: Alphabet Shares Suffer Worst Day Ever as Wall Street Doubts AI Payoff
- Admirals: Fed Rate Decision 28 October 2026, Hawkish Hold in 10-2 Vote
- Finance Calendar: Walmart Earnings November 2026
- Finance Calendar: Japan CPI November 2026
- Yahoo Finance: Nasdaq 100 Historical Data
- Theta: NVDA Q3 FY2027 Earnings Estimates and History
- The Motley Fool: Should You Buy Nvidia Stock Before 17 November?
- American Bazaar: Nvidia Rebounds Despite Wall Street Downgrades
- Al Jazeera: Nvidia Shares Plunge Amid Reports Board to Discuss CEO Huang's Future
- CappNotes: Closing Look, Wednesday 11 November 2026
- Investrade: Market Review, 11 November 2026
- Schwab: Stock Market Update, 10 November 2026
- The Glass Desk: Weekly Market Review, 13 November 2026
- Investing.com: XAU/USD Historical Data
- Investing.com: EUR/USD Historical Data
Lirunex series and website links
Sources5Research and data references for this section · tap to view▾
- Lirunex: Q3 Earnings Season Outlook, Tesla, Meta and Netflix Test a Shaken US500
- Lirunex: Fed Meeting Preview, Hawkish Hold or Second Hike
- Lirunex: Risk-On or Risk-Off, How to Read Market Sentiment When Gold and Oil Send Mixed Signals
- Lirunex: Gold FOMC Recap
- Lirunex: Gold vs Oil, Which Commodity Offers Better Trading Opportunities Right Now
Ready for the Market's Next Move?
Follow this Nvidia earnings preview in the Lirunex article news series and practise on a free Lirunex demo account; compare the account types and set alerts in the Lirunex trading app. Demo results may differ from live trading.
Open Free Demo Account | Open Live Account
Risk Disclaimer: This content is for educational and informational purposes only and does not constitute investment advice. Forex and CFD trading involve significant risk of loss and may not be suitable for all investors; see Lirunex's regulations and licences for the entities that provide the service. Past performance is not indicative of future results. High impact events may cause sharp volatility, wider spreads and sudden price movements. Please understand the risks before trading. Market data as of the 13 November 2026 close; chart cards from TradingView captures on the morning of 16 November 2026.