










Educational analysis only, not financial advice. Trading CFDs involves a high risk of loss. Market data as of 9 September 2026, 12:15pm GMT+8 (TradingView capture).
Weekly Market Overview
This week centers on two releases: the ECB's rate decision Thursday and US CPI Friday. A 25bp ECB hike is well telegraphed, so Lagarde's tone matters more than the move. Friday's CPI is the last major inflation read before the Fed's September meeting.
EUR/USD, Thursday, Sep 10, ECB Interest Rate Decision
The ECB decides on rates at 8:15pm GMT+8 Thursday, press conference at 8:45pm. A 25 basis point hike to 2.50% is widely expected, driven mostly by energy-linked inflation near 3.3%. Lagarde is expected to hike without committing to a further path, which could limit the reaction and shift focus to Friday's US CPI instead.
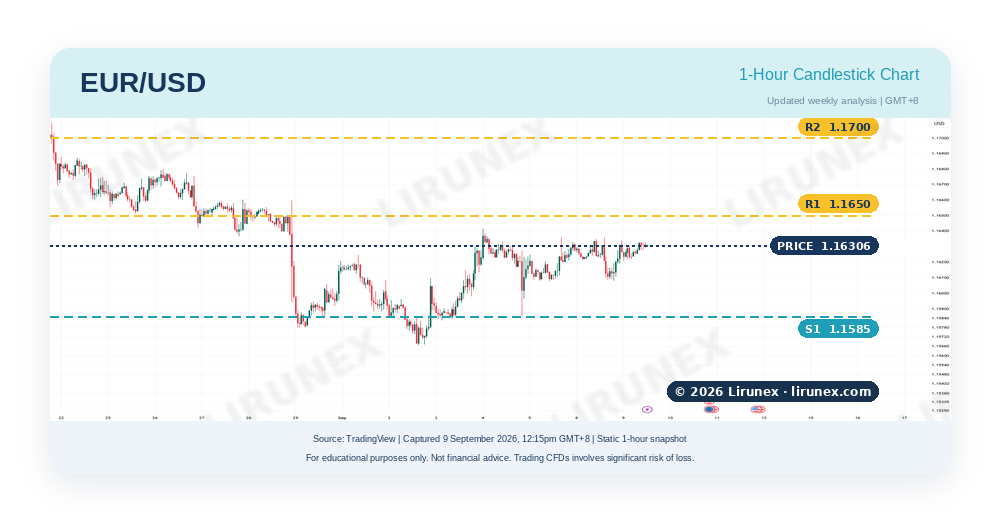
· Trend: EUR/USD trades near 1.16306, little changed over the past two days, still mid-range inside its 52-week band of 1.1325 to 1.2079.
· Resistance: 1.1650, then 1.1700 and 1.1750.
· Support: 1.1585, then 1.1500 and 1.1400.
· Watch: Lagarde's press-conference tone, a hike with no forward guidance often fades quickly.
Chart discussion: a well-telegraphed hike with limited guidance often sees the initial spike retrace within the session, watch whether EUR/USD holds any post-ECB move into Friday's CPI.
Mentor tip: a rate hike rarely moves price much if the market already expects it, the real reaction usually comes from the tone of the statement instead.
GBP/USD, Friday, Sep 11, UK GDP m/m
UK GDP for July releases at 2:00pm GMT+8 Friday, an early read on growth heading into autumn. A stronger print supports the case for the Bank of England to stay patient on cuts; a weak one could revive cut bets and pressure the pound, hours before US CPI lands the same evening.
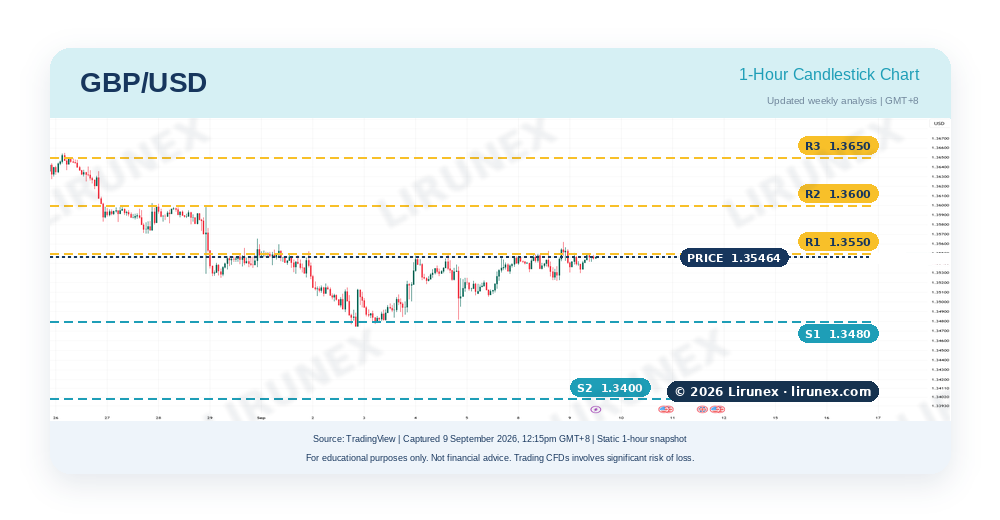
· Trend: GBP/USD trades near 1.35464, little changed just above the 1.35 mark over the past two days.
· Resistance: 1.3550, then 1.3600 and 1.3650.
· Support: 1.3480, then 1.3400 and 1.3350.
· Watch: two catalysts in one day, UK GDP at 2:00pm and US CPI at 8:30pm GMT+8.
Chart discussion: a GDP move that fails to hold into the US session often means the US number ends up mattering more, watch whether GBP/USD is still trending the same way by evening.
Mentor tip: when two releases land the same day, the first move is not always the one that sticks, wait for the second catalyst before judging the day's real direction.
Gold (XAU/USD), Friday, Sep 11, US Consumer Price Index
August's US CPI lands at 8:30pm GMT+8 Friday, the last major inflation read before the Fed's September meeting. Nowcasts point to headline CPI near 0.38% m/m and core near 0.20% m/m, a slight reacceleration from July. Fed hike odds sit at 52% versus 48%, a genuine coin flip this print could tip either way.
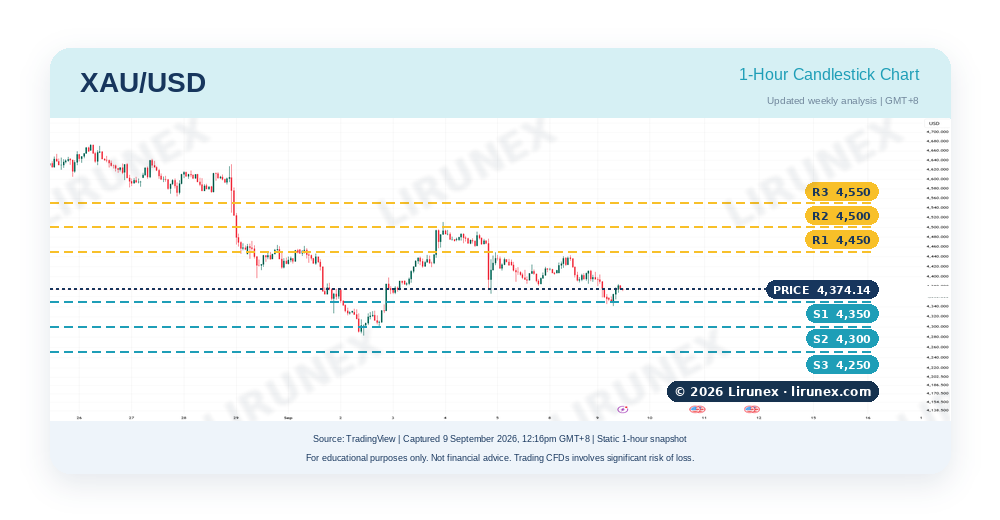
· Trend: gold has bounced to 4,374 after testing the 4,350 support flagged this week, trading back above it.
· Resistance: 4,450, then 4,500 and 4,550.
· Support: 4,350, then 4,300 and 4,250.
· Watch: whether the bounce off 4,350 holds into Friday, or fades back toward that support on renewed hike bets.
Chart discussion: a bounce off a flagged support level often gets retested before a major data print, watch whether 4,350 keeps holding as support through Friday's CPI.
Mentor tip: watch core CPI over headline, food and energy swing month to month, core is what the Fed leans on for its rate decisions.
US500, Friday, Sep 11, US Consumer Price Index
The same CPI print that moves gold also lands for US500 at 8:30pm GMT+8 Friday. The index has pulled back but stays within reach of its record. A soft print would ease pressure on the Fed and could extend the rally; a hot one would revive hike bets and risk a deeper pullback.
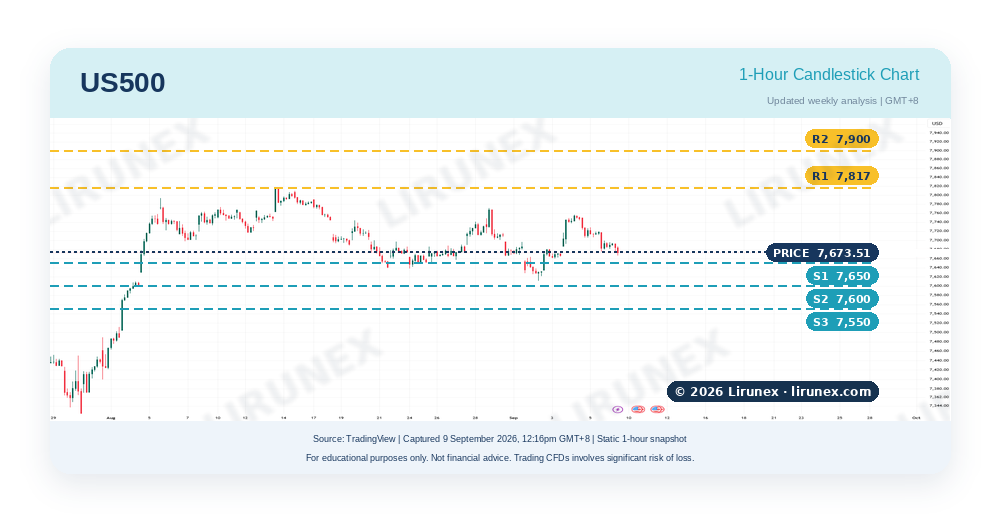
· Trend: US500 trades near 7,673.51, down two sessions, about 143 points below its record of 7,816.70 set in August.
· Resistance: 7,817, the record high, then 7,900 and 8,000.
· Support: 7,650, then 7,600 and 7,550.
· Watch: how close the index sits to its record, a hot CPI can trigger fast profit-taking.
Chart discussion: an index this close to a record tends to react sharply either way, a soft CPI could send it through 7,817 for a fresh record, a hot one could trigger a quick pullback toward support.
Mentor tip: a market at a record high often needs a genuine catalyst to break through, watch whether it closes above the level, not just touches it intraday.
Other Data to Note
Thursday's US Producer Price Index (8:30pm GMT+8) lands right after the ECB decision, an early read on wholesale price pressure ahead of Friday's CPI. Away from the calendar, an escalation in the Strait of Hormuz situation on 8 September (US action against Iranian vessels, Iranian retaliation) has pushed oil prices higher, named by market data providers as a factor behind gold's choppy trading this week, even though WTI is not one of this week's four flagged instruments.
Key Takeaway
This week's real driver is timing: a well-telegraphed ECB hike Thursday, then US CPI Friday, the last read before a Fed decision that is now a coin flip. EUR/USD and GBP/USD react earlier; gold and US500 hinge on Friday's CPI. If new to trading, compare how each instrument moves in the first few minutes versus where it settles later, that gap teaches more than the headline number. Sub-IBs and partners are welcome to share this outlook as educational content. Follow Lirunex for more weekly updates and educational insights.
Ready to Explore This Week’s Key Market Levels?
Review the selected markets and key support and resistance levels highlighted in this week’s analysis. Practise observing price movements with a free Lirunex demo account, or open a live account when you feel ready and fully understand the risks involved. Demo conditions and results may differ from live trading.
[ Open Free Demo Account ] [ Open Live Account ]
Risk Warning: This content is for educational purposes only and is not financial advice or a recommendation to trade. Market data comes from third-party sources believed reliable but is not guaranteed and may change without notice. Trading forex, gold, and CFDs carries a high level of risk; you could lose some or all of your capital, and past performance is not a reliable indicator of future results. Lirunex Limited accepts no liability for losses arising from reliance on this material, is regulated by the Labuan FSA (MB/20/0050) and the FSC Mauritius (GB24203882), and does not direct this material at any jurisdiction where its distribution would be unlawful.