










Educational analysis only, not financial advice. Trading CFDs involves a high risk of loss. Market data as of 20 August 2026, 4:35pm GMT+8.
Gold Market Recap Overview
The Fed's July minutes landed this morning at 2:00am GMT+8 and produced gold's biggest Fed-night move in three months. This gold market recap walks through that night and the two before it. Mentor tip: gold moves on changing rate expectations, not the headline itself.
What Is FOMC News, and What Does Hawkish Mean?
The FOMC is the US Federal Reserve committee that sets interest rates. It meets eight times a year, and each meeting gives us two news events: the decision on meeting night, and the minutes three weeks later. Both reach Asia at 2:00am GMT+8. Hawkish means the Fed sounds ready to raise rates. Dovish means ready to cut. Tone matters more than the decision itself, because tone changes what traders expect from the meetings ahead.
How Big Are Fed Nights for Gold?
Not every Fed night is equal. Here are gold's last five, ranked by the size of the move around the release (on gold, one pip is a 0.10 dollar move):
· Aug 20, July minutes: close to 2,000 pips, mostly before the release, reviewed below
· Jul 30, July decision: about 1,200 pips, the hawkish hold reviewed below
· Jul 9, June minutes: about 1,520 pips top to bottom, the slide that ended before the release, reviewed below
· Jun 18, June decision: about 870 pips down on a hawkish dot plot
· May 22, May minutes: about 580 pips, the quietest of the five
The three biggest are exactly the nights this recap reviews.
Thursday, Aug 20, 2:00am GMT+8 · July FOMC Minutes: Gold Breaks Higher Despite Hawkish Words
Pre-news: Wednesday was quiet, the kind of range that tempts you to expect nothing. Then, seven hours early, a Treasury buyback headline pushed yields down and gold ran about 1,700 pips, clearing R2 4,480 roughly two hours before the Fed published a word. During: the release added only the final push. Post-news: R3 4,520 was tagged about four hours later, then Thursday faded as hawkish wording firmed the dollar.
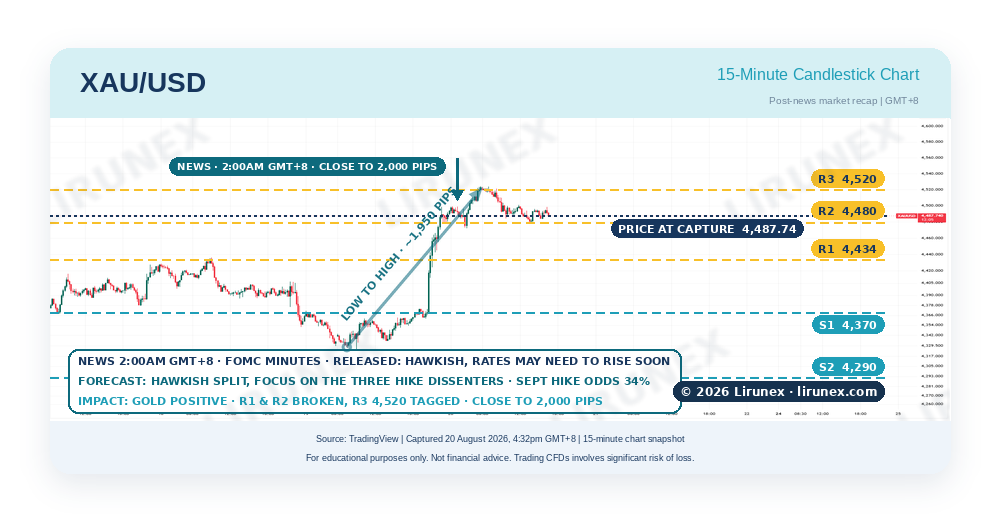
· Before: a 4,325 low on Wednesday, then a breakout from about 7:00pm GMT+8 that reached 4,499
· Result: hawkish minutes, rates may need to rise soon; September hike odds still near 34%
· After: R3 4,520 tagged about four hours on, then easing back to 4,488
· Level check: close to 2,000 pips in all, but roughly 1,700 of them landed before the release
Chart discussion: when the levels break before the event, the release becomes a test of the move rather than its cause, and old R2 4,480 is the first place to see whether this breakout has real support behind it.
Mentor tip: write down the levels above and below price before a release. Comparing what broke and what held teaches you more than any headline, and it keeps you steady when the candles get loud.
Thursday, Jul 30, 2:00am GMT+8 · July Fed Decision: A Hawkish Hold, Gold Bounces
Pre-news: gold fell all week while traders braced for a hike. Then a US and Iran flare-up lifted oil, and gold spiked before the Fed spoke. During: the decision was a hold, so the feared outcome never arrived. Post-news: gold kept the spike. Relief alone can hold a move when feared news never comes.
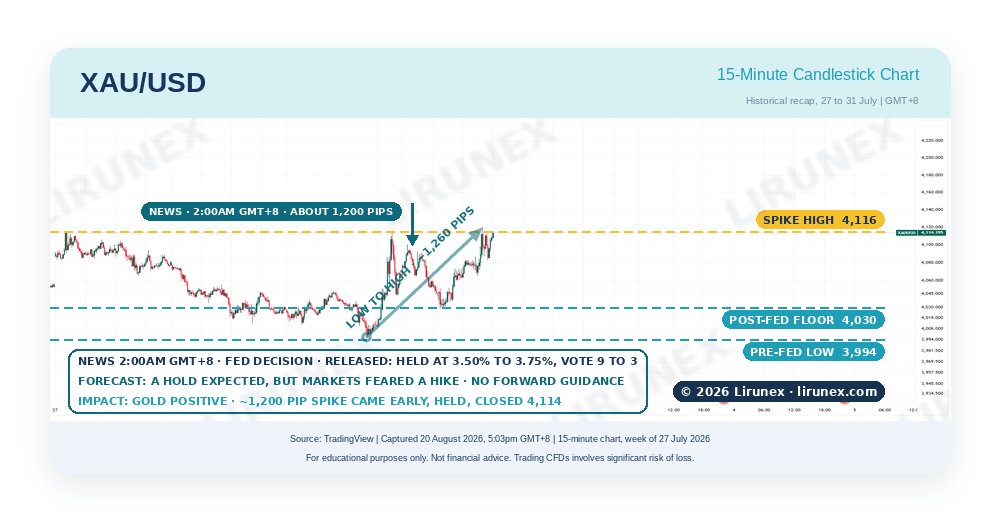
· Before: a slide to 3,994, then a spike to 4,116 on Iran headlines
· Result: rates held at 3.50% to 3.75%, a 9 to 3 vote, no forward guidance
· After: holding above a 4,030 floor on Thursday, finishing the window near 4,114
· Level check: about 1,200 pips from the low to the spike high, and the gains held
Chart discussion: when a headline and a decision pull opposite ways, the first full candle close after the news usually tells you which side won.
Mentor tip: these releases land at 2:00am GMT+8, when most of us in Asia are asleep. There is no prize for watching live, so set your levels the evening before and let the morning show you the result.
Thursday, Jul 9, 2:00am GMT+8 · June FOMC Minutes: Hawkish Tone, Gold Under Pressure
Pre-news: gold slid from 4,178 for a day and a half, and the low printed about three hours before the release. During: the minutes read hawkish and hike odds jumped, yet gold made no new low. Post-news: price held above 4,055 and climbed back toward 4,113. The selling had finished before the Fed published a word.
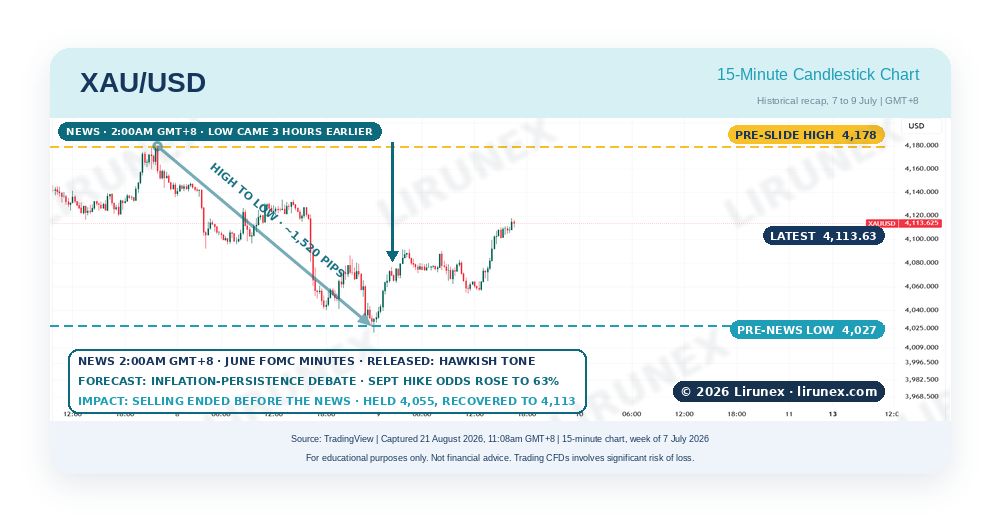
· Before: a 4,178 high fading to a 4,027 low late on July 8, hours ahead of the release
· Result: hawkish minutes; the odds of a September hike rose to about 63%
· After: no new low, a 4,055 floor, and a recovery to about 4,113
· Level check: about 1,520 pips top to bottom, with roughly 870 pips recovered
Chart discussion: when hawkish news cannot make a new low, it usually means the move was already priced, and the level that held becomes the one to watch afterwards.
Mentor tip: minutes describe a meeting three weeks old. If the data has moved on since, the market often shrugs, so check what has changed before you expect a strong reaction.
The Pattern, and What Comes Next for Gold
Three Fed nights, one pattern worth carrying forward.
The pattern:
· The biggest candles often printed hours before the release, not on it
· The reaction followed the surprise and the yield move, never the headline alone
· This week hawkish words lost to falling yields, which is why we mark levels the evening before
On the chart now:
· Can gold hold above the broken 4,480 (R2), with 4,500 as a possible floor and R3 4,520 above
· Friday's flash PMIs move the dollar side, with the US print at 9:45pm GMT+8
On the calendar:
· Next Fed decision: Thursday, September 17, 2:00am GMT+8, closing the September 15 and 16 meeting
· It carries the quarterly dot plot, and markets price roughly a 34% chance of a hike
· Minutes follow in early October; the year's last meetings are October 27 and 28, and December 8 and 9
Sub-IBs and partners are welcome to share this recap as educational content. Follow Lirunex for more weekly market updates and educational insights.
Ready to Watch the Next One?
Look back at how the markets in this recap reacted around their key support and resistance levels. You can practise following price movements like these on a free Lirunex demo account, and move to a live account only when you feel ready and fully understand the risks involved. Please note that demo conditions and results may differ from live trading.
[ Open Free Demo Account ] [ Open Live Account ]
Risk Disclaimer: This market recap is educational content only, not financial advice or a recommendation to trade. Market data comes from third-party sources and is not guaranteed and may change without notice. Trading forex, gold, and CFDs involves a high level of risk: you could lose some or all of your capital, and past performance is not a reliable indicator of future results. Lirunex Limited accepts no liability for losses arising from reliance on this material, is regulated by the Labuan FSA (MB/20/0050) and the FSC Mauritius (GB24203882), and does not direct this material at any jurisdiction where its distribution would be unlawful.